


Icon plc
eröffnet am 14.03.17 13:26:19 von
neuester Beitrag 24.09.22 15:16:39 von
neuester Beitrag 24.09.22 15:16:39 von
Beiträge: 14
ID: 1.248.816
ID: 1.248.816
Aufrufe heute: 0
Gesamt: 2.281
Gesamt: 2.281
Aktive User: 0
ISIN: IE0005711209 · WKN: 932242 · Symbol: IJF
279,80
EUR
+3,44 %
+9,30 EUR
Letzter Kurs 22.04.24 Tradegate
Neuigkeiten
04.04.24 · wO Chartvergleich |
03.04.24 · Business Wire (engl.) |
25.03.24 · Business Wire (engl.) |
26.02.24 · Business Wire (engl.) |
21.02.24 · Business Wire (engl.) |
Werte aus der Branche Gesundheitswesen
| Wertpapier | Kurs | Perf. % |
|---|---|---|
| 1,2800 | +73,21 | |
| 0,7400 | +38,58 | |
| 3,2100 | +24,90 | |
| 0,5501 | +18,33 | |
| 0,6080 | +18,06 |
| Wertpapier | Kurs | Perf. % |
|---|---|---|
| 0,5925 | -15,36 | |
| 1,5500 | -19,27 | |
| 2,7600 | -20,69 | |
| 0,9102 | -42,03 | |
| 0,7500 | -48,98 |
Beitrag zu dieser Diskussion schreiben
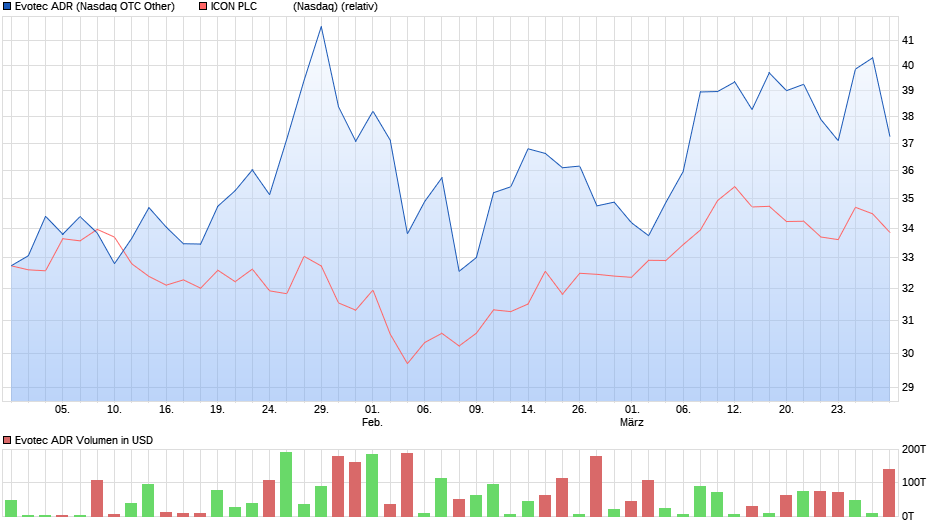
Antwort auf Beitrag Nr.: 56.600.882 von faultcode am 03.01.18 15:28:20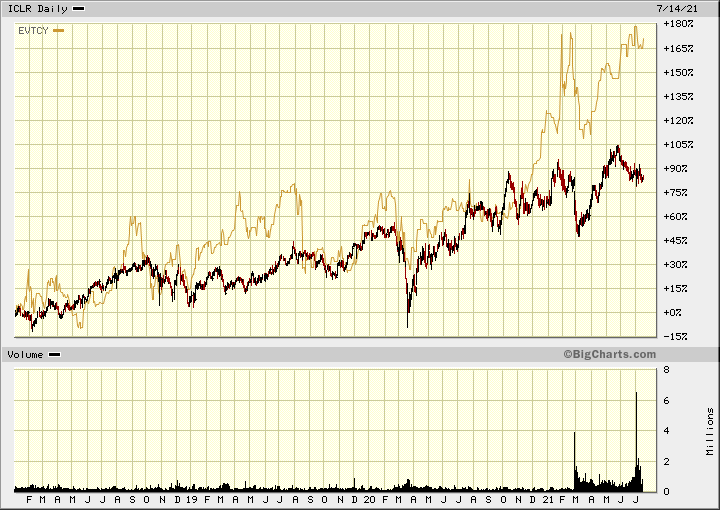
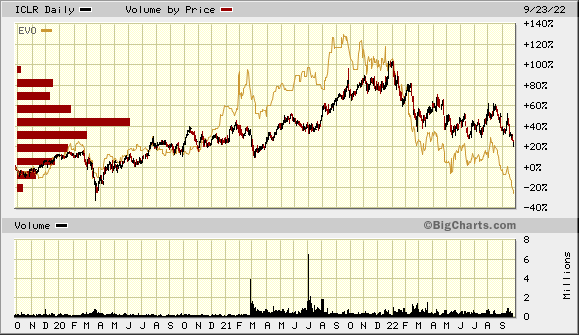
seit Anfang 2021 fehlen die Shorties bei Evotec. Der Anstieg Ende 2020 war noch mit Shorties:
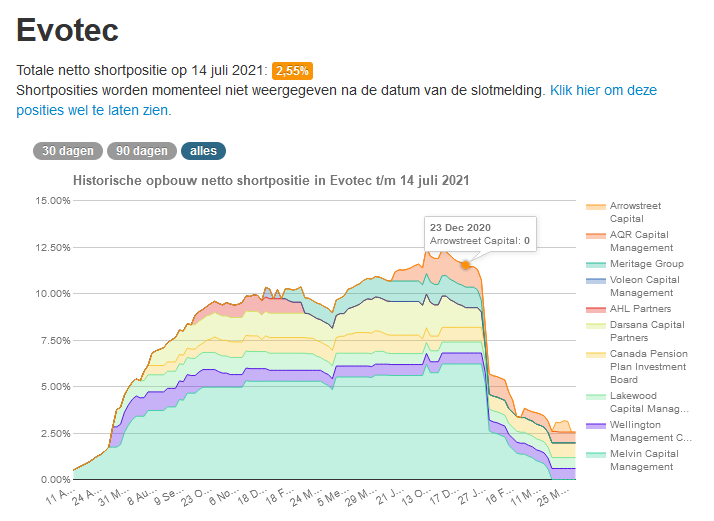
https://shortsell.nl/short/EvotecSE/all

seit Anfang 2021 fehlen die Shorties bei Evotec. Der Anstieg Ende 2020 war noch mit Shorties:

https://shortsell.nl/short/EvotecSE/all
Antwort auf Beitrag Nr.: 56.600.882 von faultcode am 03.01.18 15:28:20
05.01.19
Evotec hat gewonnen!
--> nicht mehr:
(beide Werte schütten keine Dividende aus)
Zitat von faultcode: ...
Handelsschluss 2.1.2018:
- ICLR: USD114.48 (http://investor.iconplc.com/)
- EVTCY: USD32.74
...
05.01.19
Evotec hat gewonnen!
--> nicht mehr:

(beide Werte schütten keine Dividende aus)
Antwort auf Beitrag Nr.: 56.600.882 von faultcode am 03.01.18 15:28:20
28.12.2018 (+):
- ICLR: USD127.15 (NASDAQ/GS)
- EVTCY: USD39.97 (OTC)
=>
- ICLR: (USD127.15 - USD114.48) / USD114.48 = +11.1%
- EVTCY: (USD39.97 - USD32.74) / USD32.74 = +22.1%
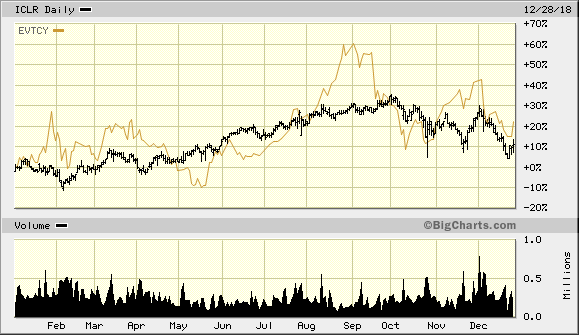
=> neue Runde 2019: es gelten die Kurse vom 28.12.2018 (+) bis 30.12.2018
Evotec hat gewonnen!
Zitat von faultcode: ...
Handelsschluss 2.1.2018:
- ICLR: USD114.48 (http://investor.iconplc.com/)
- EVTCY: USD32.74
...
28.12.2018 (+):
- ICLR: USD127.15 (NASDAQ/GS)
- EVTCY: USD39.97 (OTC)
=>
- ICLR: (USD127.15 - USD114.48) / USD114.48 = +11.1%
- EVTCY: (USD39.97 - USD32.74) / USD32.74 = +22.1%

=> neue Runde 2019: es gelten die Kurse vom 28.12.2018 (+) bis 30.12.2018
habe meine Position geschmissen; sind ganz gut gelaufen, und nun schon hoch bepreist --> Wettbewerb mit EVT läuft trotzdem weiter  :
:
 :
:Trading Spotlight
Antwort auf Beitrag Nr.: 58.209.716 von faultcode am 13.07.18 17:50:53
On a per-share basis, the Dublin-based company said it had profit of $1.31. Earnings, adjusted for restructuring costs, came to $1.51 per share.
The results exceeded Wall Street expectations. The average estimate of eight analysts surveyed by Zacks Investment Research was for earnings of $1.48 per share.
The contract research organization posted revenue of $641.6 million in the period, also exceeding Street forecasts. Six analysts surveyed by Zacks expected $633.8 million.
Icon PLC expects full-year earnings to be $5.98 to $6.12 per share, with revenue in the range of $2.56 billion to $2.64 billion.
Icon PLC shares have climbed 25 percent since the beginning of the year. In the final minutes of trading on Wednesday, shares hit $139.94, an increase of 41 percent in the last 12 months.
https://finance.yahoo.com/news/icon-plc-2q-earnings-snapshot…
Q2
DUBLIN (AP) _ Icon PLC (ICLR) on Wednesday reported second-quarter earnings of $71.9 million.On a per-share basis, the Dublin-based company said it had profit of $1.31. Earnings, adjusted for restructuring costs, came to $1.51 per share.
The results exceeded Wall Street expectations. The average estimate of eight analysts surveyed by Zacks Investment Research was for earnings of $1.48 per share.
The contract research organization posted revenue of $641.6 million in the period, also exceeding Street forecasts. Six analysts surveyed by Zacks expected $633.8 million.
Icon PLC expects full-year earnings to be $5.98 to $6.12 per share, with revenue in the range of $2.56 billion to $2.64 billion.
Icon PLC shares have climbed 25 percent since the beginning of the year. In the final minutes of trading on Wednesday, shares hit $139.94, an increase of 41 percent in the last 12 months.
https://finance.yahoo.com/news/icon-plc-2q-earnings-snapshot…
Antwort auf Beitrag Nr.: 57.442.715 von faultcode am 02.04.18 13:37:14Huch! Was ist denn hier passier?!? 


Antwort auf Beitrag Nr.: 57.442.925 von faultcode am 02.04.18 14:24:55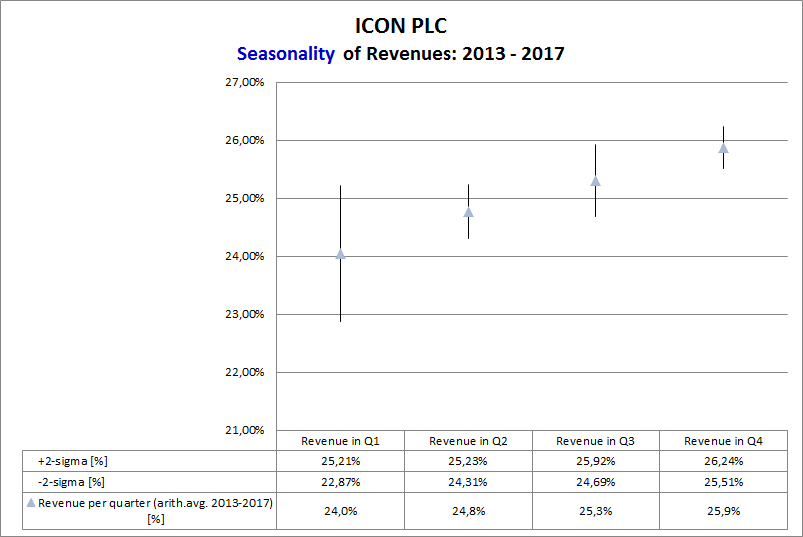
=> dass das 4.Quartal nur die geringste Variabilität hat, mag ein gutes oder schlechtes Zeichen sein:
a/ gut, weil es offenbar nicht benutzt wird, um die Jahresprofitabilität noch zu "tunen"
b/ schlecht, weil ich (noch nicht) den Grund für diese Auffälligkeit kenne
Hier die Saisonalität beim operativen Ergebnis (EBIT):
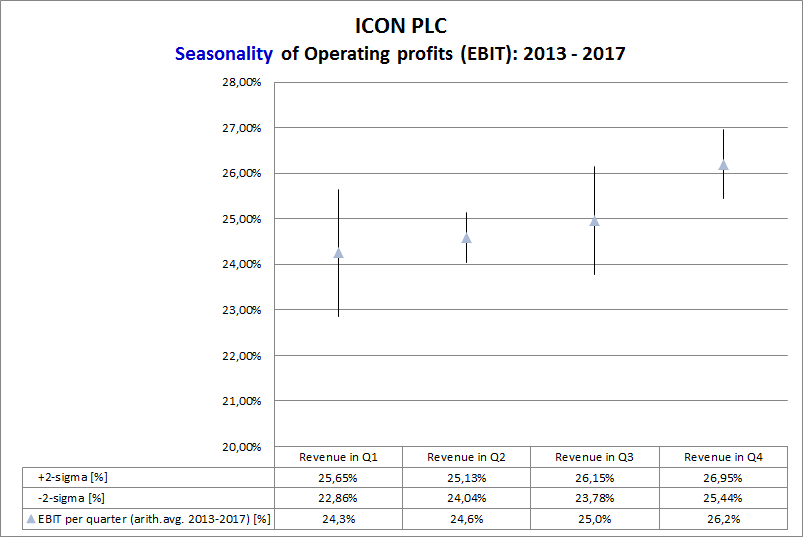
=> auffällig: Q1 und Q3 weisen beide jeweils eine höhere Variabilität als Q2 und Q4 aus!
=> insgesamt wenig auffällig:
1/ Umsatz und oper.Ergebnis sind - im Schnitt - im Schlussquartal am höchsten, und..
2/ ..beide Grössen steigern sich - im Schnitt - von Quartal zu Quartal im Laufe eines Jahres.
Saisonalität im Geschaft von Icon PLC
=> dass das 4.Quartal nur die geringste Variabilität hat, mag ein gutes oder schlechtes Zeichen sein:
a/ gut, weil es offenbar nicht benutzt wird, um die Jahresprofitabilität noch zu "tunen"
b/ schlecht, weil ich (noch nicht) den Grund für diese Auffälligkeit kenne
Hier die Saisonalität beim operativen Ergebnis (EBIT):
=> auffällig: Q1 und Q3 weisen beide jeweils eine höhere Variabilität als Q2 und Q4 aus!
=> insgesamt wenig auffällig:
1/ Umsatz und oper.Ergebnis sind - im Schnitt - im Schlussquartal am höchsten, und..
2/ ..beide Grössen steigern sich - im Schnitt - von Quartal zu Quartal im Laufe eines Jahres.
Antwort auf Beitrag Nr.: 57.442.715 von faultcode am 02.04.18 13:37:14
=> damit ist die historisch hohe Pfizer-Abhängigkeit gemeint
=> in 2014 und 2015 lag diese bei 31% vom Umsatz, in 2017 bei ca. noch 18% und soll eben auf 12..14% in 2018 weiter abgesenkt werden - bei weiterhin steigendem Umsatz
=> ich weiss allerdings nicht, was die langfristige Zielgrösse von ICON hier sein soll (..und was genau der Hintergrund dazu ist )
)
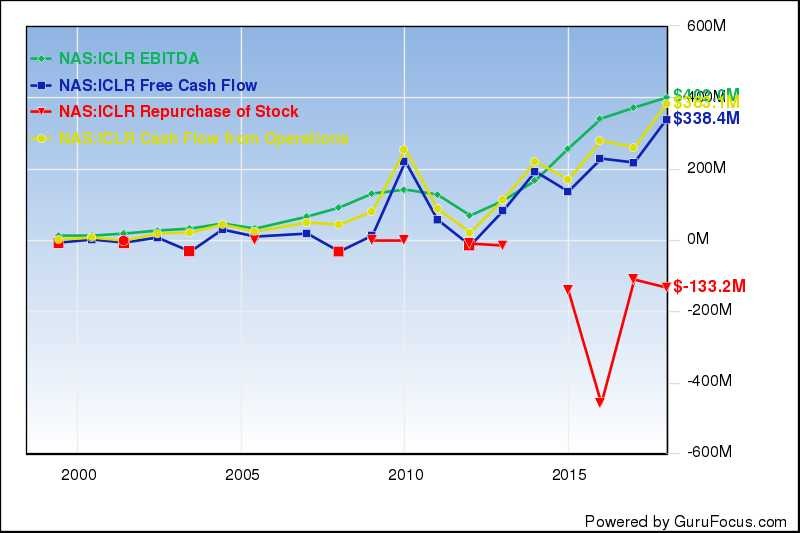
=> man muss allerdings auch dazusagen, dass ICON die EPS über ihr Aktienrückkaufprogramm steuert --> FCF dazu ist ja stabil gegeben:
=> daher wäre ein Blick auf die Verbindlichkeiten ganz gut:
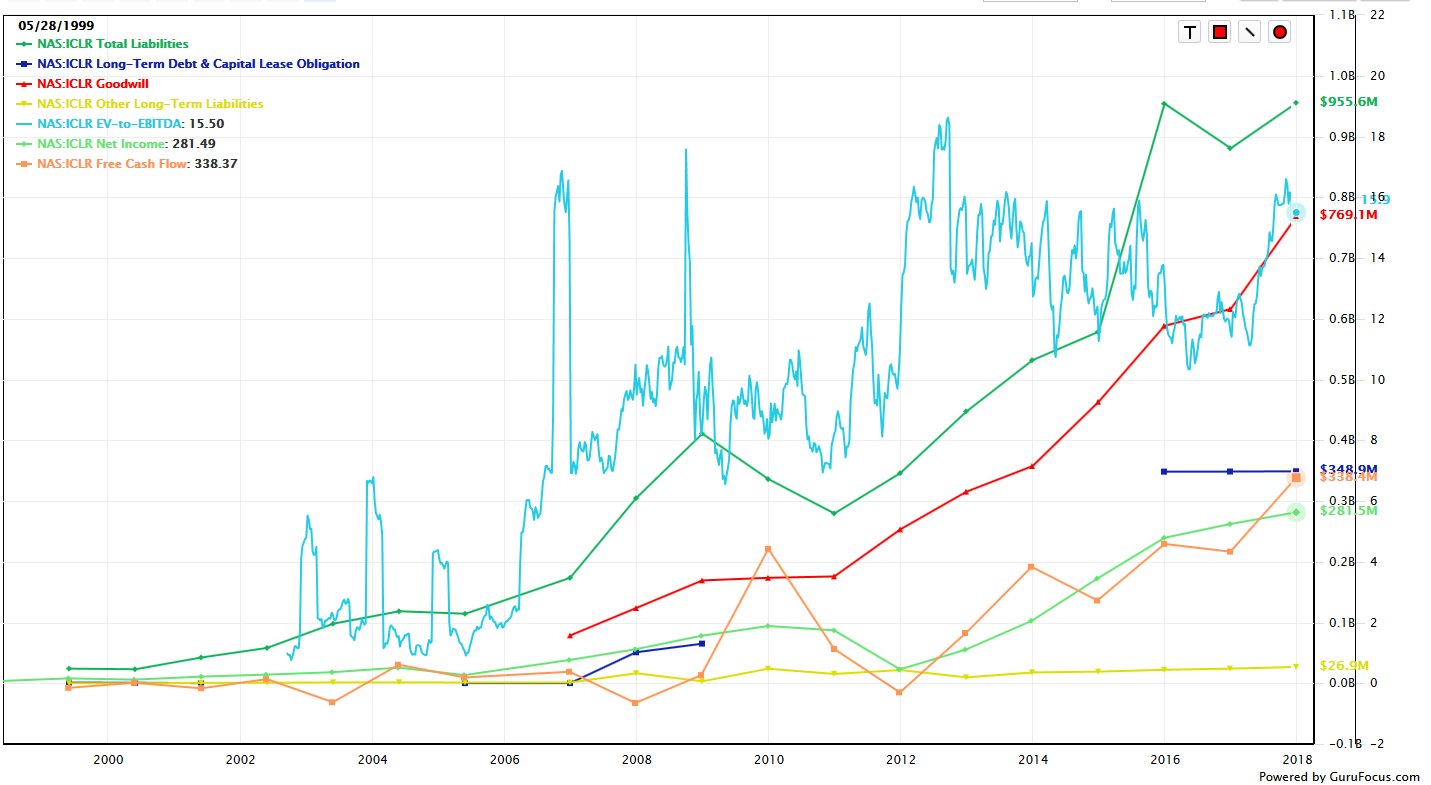
https://www.gurufocus.com/chart/ICLR#&serie=,,id:Total_Liabi…
=> man sieht vieles - aber auch:
* dass ICON nicht durchgehend Long term debt (und cap.lease obl.) hatte - aber wieder zuletzt
* was stört ist eben, dass der Goodwill durch die ganzen Übernahmen der Vergangenheit sich langsam aufgeblasen hat:
=> Buchwert-Substanz steckt nur wenig in der Bilanz (und Aktie); z.Z.:
* PB Ratio 5.37
* Price-to-Tangible-Book 18.26
* Piotroski F-Score lag zuletzt bei 7/9, also eins unter "Value".
Aber natürlich, ein Schnäppchen haben wir hier nicht vorliegen mit z.Z.:
* Price-to-Free-Cash-Flow 19.22
* EV-to-EBITDA 15.87
..aber eben auch kein verstecktes Schulden-Schreckgespenst am Horizont
Zitat von faultcode: ...* Top customer concentration to reduce to circa 12 - 14% of revenue from circa 18% in 2017...
=> damit ist die historisch hohe Pfizer-Abhängigkeit gemeint
=> in 2014 und 2015 lag diese bei 31% vom Umsatz, in 2017 bei ca. noch 18% und soll eben auf 12..14% in 2018 weiter abgesenkt werden - bei weiterhin steigendem Umsatz
=> ich weiss allerdings nicht, was die langfristige Zielgrösse von ICON hier sein soll (..und was genau der Hintergrund dazu ist
 )
)=> man muss allerdings auch dazusagen, dass ICON die EPS über ihr Aktienrückkaufprogramm steuert --> FCF dazu ist ja stabil gegeben:

=> daher wäre ein Blick auf die Verbindlichkeiten ganz gut:

https://www.gurufocus.com/chart/ICLR#&serie=,,id:Total_Liabi…
=> man sieht vieles
- aber auch:* dass ICON nicht durchgehend Long term debt (und cap.lease obl.) hatte - aber wieder zuletzt
* was stört ist eben, dass der Goodwill durch die ganzen Übernahmen der Vergangenheit sich langsam aufgeblasen hat:
=> Buchwert-Substanz steckt nur wenig in der Bilanz (und Aktie); z.Z.:
* PB Ratio 5.37
* Price-to-Tangible-Book 18.26
* Piotroski F-Score lag zuletzt bei 7/9, also eins unter "Value".
Aber natürlich, ein Schnäppchen haben wir hier nicht vorliegen mit z.Z.:
* Price-to-Free-Cash-Flow 19.22
* EV-to-EBITDA 15.87
..aber eben auch kein verstecktes Schulden-Schreckgespenst am Horizont
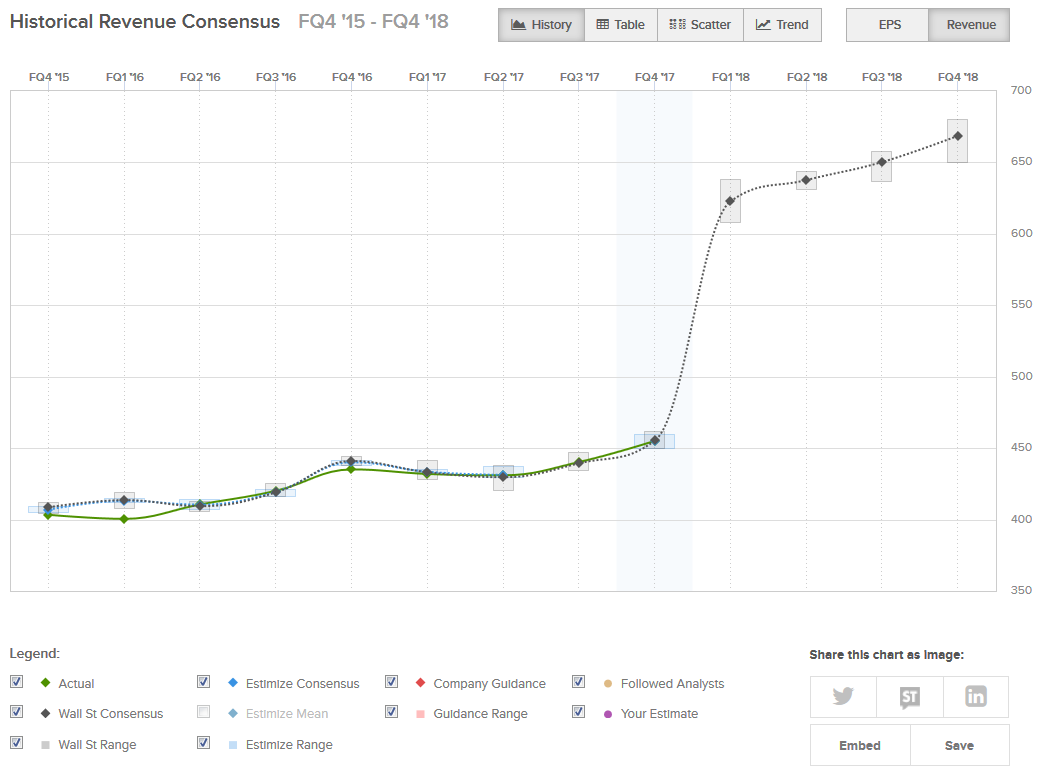
Antwort auf Beitrag Nr.: 56.604.518 von faultcode am 03.01.18 19:25:39=> https://www.estimize.com/iclr/fq4-2017?metric_name=revenue&c…
=> Umsatz im Anflug
(*)
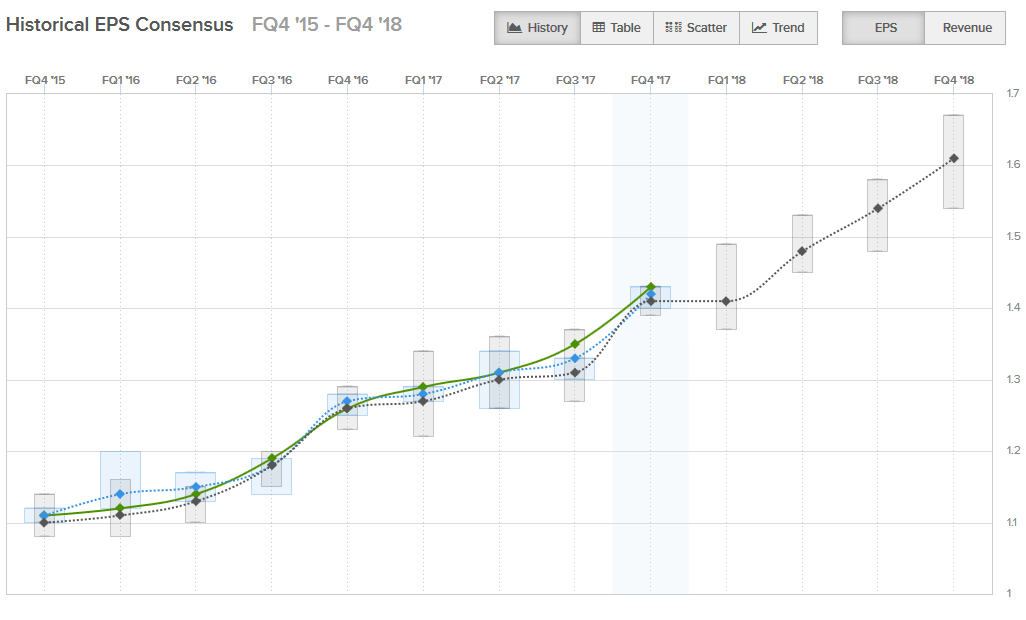
(*)
9.1.2018
ICON Issues Financial Guidance for Full Year 2018
http://investor.iconplc.com/releasedetail.cfm?ReleaseID=1053…
...
The full year 2018 financial guidance assumes:
* Top customer concentration to reduce to circa 12 - 14% of revenue from circa 18% in 2017.
* US dollar to Euro exchange rate of $1.20 (constant currency revenue growth of circa 7%).
* An effective tax rate of circa 12%.
* Circa $360 million of free cash flow and capital expenditures of circa $50 million. (y)
* $25 million worth of shares repurchased in Q4 2017 from current up to $400 million repurchase programme contributing circa 3c to 2018 earnings.
* Remaining authorisation of up to $157 million to be executed opportunistically during 2018 depending on cash commitments to support M&A pipeline, no additional earnings benefit included in guidance.
With respect to 2017, the company confirmed its current guidance, of revenue in the range of $1,740 - $1,770 million and earnings in the range of $5.30 - $5.40.
(y) Evotec AG 2017 actual results:
* "Simple" Free Cash Flow: -EUR6.77m (oper.cash flow - CAPEX)
* CAPEX: EUR17.6m
2018e, FactSet (FS) + Thomson Reuters (TR), 2018-04-02:
* Free Cash Flow|FS: EUR33.43m
* CAPEX|TR: EUR23.3m
=>
2018e FCF/CAPEX:
* ICON: 7.2
* Evote: 1.4
=> mal schauen, wie lange blau sich noch oben halten kann:
=> Umsatz im Anflug


(*)

(*)
9.1.2018
ICON Issues Financial Guidance for Full Year 2018
http://investor.iconplc.com/releasedetail.cfm?ReleaseID=1053…
...
The full year 2018 financial guidance assumes:
* Top customer concentration to reduce to circa 12 - 14% of revenue from circa 18% in 2017.
* US dollar to Euro exchange rate of $1.20 (constant currency revenue growth of circa 7%).
* An effective tax rate of circa 12%.
* Circa $360 million of free cash flow and capital expenditures of circa $50 million. (y)
* $25 million worth of shares repurchased in Q4 2017 from current up to $400 million repurchase programme contributing circa 3c to 2018 earnings.
* Remaining authorisation of up to $157 million to be executed opportunistically during 2018 depending on cash commitments to support M&A pipeline, no additional earnings benefit included in guidance.
With respect to 2017, the company confirmed its current guidance, of revenue in the range of $1,740 - $1,770 million and earnings in the range of $5.30 - $5.40.
(y) Evotec AG 2017 actual results:
* "Simple" Free Cash Flow: -EUR6.77m (oper.cash flow - CAPEX)
* CAPEX: EUR17.6m
2018e, FactSet (FS) + Thomson Reuters (TR), 2018-04-02:
* Free Cash Flow|FS: EUR33.43m
* CAPEX|TR: EUR23.3m
=>
2018e FCF/CAPEX:
* ICON: 7.2

* Evote: 1.4
=> mal schauen, wie lange blau sich noch oben halten kann:

Icon plc


