


ENEGEX LTD hat Gebiete die 200 km um die Ni-Cu-PGE-Entdeckung in Julimar liegen (Seite 4)
eröffnet am 25.02.21 10:32:58 von
neuester Beitrag 10.05.22 16:56:05 von
neuester Beitrag 10.05.22 16:56:05 von
Beiträge: 110
ID: 1.343.373
ID: 1.343.373
Aufrufe heute: 0
Gesamt: 2.977
Gesamt: 2.977
Aktive User: 0
Top-Diskussionen
| Titel | letzter Beitrag | Aufrufe |
|---|---|---|
| vor 57 Minuten | 4060 | |
| vor 53 Minuten | 4017 | |
| vor 1 Stunde | 2864 | |
| vor 1 Stunde | 2419 | |
| vor 48 Minuten | 1722 | |
| vor 1 Stunde | 1344 | |
| vor 1 Stunde | 1301 | |
| vor 1 Stunde | 1023 |
Meistdiskutierte Wertpapiere
| Platz | vorher | Wertpapier | Kurs | Perf. % | Anzahl | ||
|---|---|---|---|---|---|---|---|
| 1. | 1. | 18.053,53 | +0,65 | 195 | |||
| 2. | 2. | 133,88 | +0,47 | 127 | |||
| 3. | 19. | 0,2020 | +10,99 | 81 | |||
| 4. | 3. | 2.312,77 | -0,62 | 78 | |||
| 5. | 4. | 6,8440 | -0,78 | 46 | |||
| 6. | 9. | 43,50 | -3,76 | 45 | |||
| 7. | 17. | 4,6600 | +1,44 | 38 | |||
| 8. | 5. | 684,80 | +1,66 | 37 |
Beitrag zu dieser Diskussion schreiben
Antwort auf Beitrag Nr.: 68.513.118 von Montekaolino am 15.06.21 14:32:10aus HC
Im no geo expert but most of the PGE finds I have been following have been old reef structures.Considering that and looking at EM surveys I think ENX's north tenaments are very interesting. The red lines I have drawn is an area where I think a old reef could have been.
POD and CHN's finds seem to go from a deep red to deep blue like a sudden drop off. EXN's northen areas seem like a shallow reef system with yellows to dark blue. If true could mean cheaper mining costs with no need for underground mining. Thoughts?
Antwort auf Beitrag Nr.: 68.513.100 von Montekaolino am 15.06.21 14:29:37
noch was
Geoview WA , amazing amount of info free, For those interested. Just Google and go.
The measurement is a differential from ambient earth field. No driving source. The notes say total magnetic intensity, all 3 magnetic components measured to find the magnitude at a height, corrected. The site also gives just the vertical 1VD which is useful to really zero on a magnetic target. When your above a strong target all the field goes vertical. Red as I have said before are static magnetic field highs, deep blue is a magnetic low.
The more I look of "wild pig", which I did pick out mainly because of the farm theme for fun, those circular pimples arcing across the top of the pic inside the magnetic low are good objectives, trended intrusive look, bend means alot of strain on the geology creating channels for metallic fluid flow. Tons of other leads on other tenements with geology to support, .keep a fully functioning exploration company years to map, and drill the top 10.
From metadata of Geoview describing the magnetic map
The magnetic data are generated from Federal and State government data sets acquired with a line spacing of 500 metres or less, and selected open file Company data sets at various line spacings. Units are nT. IMAGE DESCRIPTION Image files are supplied in JP2 compression format. JP2 files can be viewed using ER Viewer or various GIS applications. Total magnetic intensity (TMI) - The data are displayed as a pseudo colour image with north east illumination (azimuth 45°, elevation 45°). Values from low to high are represented by colours blue to red. Reduced to Pole (RTP) of TMI - The data are displayed as a pseudo colour image with north east illumination (azimuth 45°, elevation 45°). Values from low to high are represented by colours blue to red. First Vertical Derivative (1VD) of TMI - The data are displayed as a greyscale image with histogram equalization.
Iam no expert, long background in physics, some geophys... Understand EM very well, pluses and minuses.
As said, red in the magnetic map is mainly ferrous... Magnetite definitely in Northam Iron areas mainly and probably most other places in the terrane. Indicates upper crust activity not necessarily PGEs or any economic material. The Jury is out on how PGE express relative to these features. CHN has had good success with that theory.
Looking around Kalgoorlie Boulder, about 70% of the mines lie within 20km of a significant magnetic feature, of those about 30% are offset from the magnetic feature by more than a few km. So about +30-40% chance of finding something not immediately related to a strong feature in one of the !ost drilled areas of the world. The Super pit is not on a strong mag feature.
Good luck trying to spot Boddington WA +15MOz by its magnetic feature.
The company needs to exploit it's MC to build productive support based on lead expectation.... Next step?
Antwort auf Beitrag Nr.: 68.513.061 von Montekaolino am 15.06.21 14:27:17
noch was aus HC
Nice rise and must be due to winter rise of potato prices. I was wondering how we ended up with 3500km2 of land so did a search for Ernest Albers our CEO. Turns out he's no small potatos and he's worth about 100million. His company specialist is to seek and buy up tenaments near companies that found massive discoveries . He's ceo of oxx and pko both of which do same things. So far all we found on ENX is spuds so explain the dull share price. So we have a good potato farming leader here. We are worth over $30m in sacks of potato which IMO is as cheap as chips.
Antwort auf Beitrag Nr.: 68.509.899 von Montekaolino am 15.06.21 09:59:55Based on Page N37 - Exploration for New Deposits.....
This lead to a hypothesis that all colours are indifferent for PGE minerals - i.e. the green, blue, yellow, just worth as much as the red and orange, so they should all be worth something or nothing.
Let's take this to an extreme...What would ENX's market cap be if ENX's EM is full of red and orange on its 3500km2? The answer might offer you a glimpse of how much ENX is being mispriced currenly by possible market bias.
MAN is another excellent reference as both haven't started drilling.
MAN ~$80m market cap with 142km2.
ENX ~$30m market cap with 3500km2 (Less than half of MAN's market cap, >30x more area exposure!)
Again, based on the above hypothesis, you can already guess which one I would prefer holding.
Counter-argument - why not get both or others? (Yes, true. Therefore, I'm also holding other Julimar explorers like PUR, CPN etc.)
JLC
Antwort auf Beitrag Nr.: 68.509.881 von Montekaolino am 15.06.21 09:58:33 HC
That is true as those red and orange bits on EM should help to identify drilling targets.
But if we are all after PGEs, all areas (green, orange, red) should be indifferent according to the below reference. (hypothesis)
"High-resolution aeromagnetic surveys can be used to map igneous layering and tectonic structures but generally do not give direct indication of mineralized rock"
https://pubs.usgs.gov/pp/1802/n/pp1802n.pdf
Page N37 - Exploration for New Deposits
Therefore, @mhkforevermci, I'm betting that the market is overpaying for those areas in red and underpaying those in green, just as you highlighted.
And hence, the reason I'm here.
But when I see @trousergecko's post, I just can't help but get excited as well.
Trading Spotlight
Antwort auf Beitrag Nr.: 68.509.791 von Montekaolino am 15.06.21 09:49:52noch was
I think a better comparison table should be total "red areas" vs "market cap" to see how things might stack up.
Orange areas (redish/yellowish) should get sum credit as well.


I think a better comparison table should be total "red areas" vs "market cap" to see how things might stack up.
Orange areas (redish/yellowish) should get sum credit as well.
Antwort auf Beitrag Nr.: 68.509.614 von Montekaolino am 15.06.21 09:39:13Info
ENX Historisch - 1 Tag
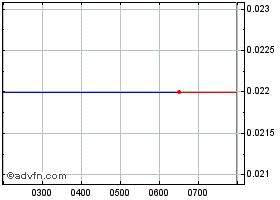
ENX Historisch - 1 Tag
Antwort auf Beitrag Nr.: 68.509.566 von Montekaolino am 15.06.21 09:35:36
noch was
On the farm theme
Prospect "Screaming Wild Pig"
Never been drilled, probably not very high on the list of ENX opportunities, just browsing the territory.
The mag outline looks the animal. The mouth (right bottom, two red areas converging, to make the jaws and tail (the circular bright red top left, intrusion?). The "pig" is sitting on a significant gravity feature that is circular donnut-like rounding back into the next tenement to the south. Length about 6km long. A couple of sutures crossed through the middle, creating a smaller high. Eye, ears and legs running, boy? A series of round features including the tail, inside the bend of the magnetic low (blue) across the top.

Market is trying to work out the risks that can't be calculated as precisely as area, the spreadsheet is part. The recent market opinion and mine is hopefully.
noch was
On the farm theme
Prospect "Screaming Wild Pig"
Never been drilled, probably not very high on the list of ENX opportunities, just browsing the territory.
The mag outline looks the animal. The mouth (right bottom, two red areas converging, to make the jaws and tail (the circular bright red top left, intrusion?). The "pig" is sitting on a significant gravity feature that is circular donnut-like rounding back into the next tenement to the south. Length about 6km long. A couple of sutures crossed through the middle, creating a smaller high. Eye, ears and legs running, boy? A series of round features including the tail, inside the bend of the magnetic low (blue) across the top.
Market is trying to work out the risks that can't be calculated as precisely as area, the spreadsheet is part. The recent market opinion and mine is hopefully.
Antwort auf Beitrag Nr.: 68.498.232 von Montekaolino am 14.06.21 09:21:48 aus HC
Hi @TheArchitech, I have been reflecting on your post for the whole weekend and it strongly resonates with my hypothesis.
This is my attempt to illustrating my hypothesis in the context of your post.
PUR $73m with 650km2 project area (6.5x of OAR and 19% of ENX)
OAR $23m with 100km2 project area (15% of PUR and 3% of ENX)
ENX $33m with 3500km2 project area
There are two ways we could argue about ENX's market cap vs its peers:
1. % Chance of discovery
For instance, we were to believe that there is >19% chance of an equivalent of PUR within ENX, then ENX may warrant a similar market cap as PUR.
2. Size of discovery
On the other hand, @TraderRR called $100m market cap. This is about 1.5x PUR's market cap. Hence, if he/she were to believe there's a chance of 1.5x PUR's size contained within ENX, then ENX may warrant a market cap of 1.5x PUR in her/his perspective. (i.e. <30% chance, 900km2 of PUR within 3500km2 of ENX)
It does get exciting if we were to combine other data and information, to triangulate (i.e. shouldn't be depending upon solely) and challenge the market caps of ENX and its Julimar peers.
@Beaza79, I also included OAR's data and I hope you can share my perspective too.
All IMO. Open for discussion and feedback welcome.
Antwort auf Beitrag Nr.: 68.498.178 von Montekaolino am 14.06.21 09:17:52noch was
Great explanation and I will also have a go.
By the way, potatoes do not stop growing during public holidays! Just joking.
JLC
---
Disclaimer – All in my opinion only and not financial/investment advice. I have zero nada geology knowledge, and this is my attempt in learning about the explorers. Always do your own research and question what you see.
A quick and dirty way of benchmarkingThere are many ways to benchmark these explorers, and one way would be to look at the market cap (Mcap)per project area.
This concept is similar to the property market by comparing land prices across different suburbs in dollar per square meter ($/sqm).
However, extreme caution must be taken when using the tables below, as each explorer is unique with countless assumptions that could influence its market cap, project area, and subsequently MCap/km2.
The purpose of this table (thanks to @Maxi II again) is to help investors, like myself, to ask better questions, and attempt to better understand the underlying assumptions which impact these explorers. For examples,
What observations could we draw from these values?
Why does the market pay a higher MCap/km2 for some explorers than others? What do they have in common?
For anomalies, are both market cap and project area being shown correctly in this table? i.e. does the market cap actually include other projects? Is this a JV project? (e.g. VMS’s market cap also include other projects and it is a JV with CHN; therefore, MCap/km2 needs to be re-adjusted)
What factors and assumptions would have a positive impact (or negative) on these values?
Does drilling commencement have an impact on MCap/km2?
Where are these explorers? Does the market pay different MCap/km2 for different regions? (i.e. Julimar vs others)
Based on other information and data, what is then the fair adjusted MCap/km2 for a given explorer? Why? Why not?
How do the explorers compare with their project areas and the assumed % of the success rate in making a discovery? How is this being reflected by their MCap/km2?
Whilst this should not be the sole benchmark or analysis to rely upon, this can help us in building our own hypothesis, to triangulate with other information/research/analysis, and ultimately better understanding them to increase our odds of identifying market mispricing.
Multiplier (to ENX) Post #:53802308

The context of the multiplier column is to illustrate how much more the market is currently paying for, in MCap/km2, of other PGE explorers vs the baseline of ENX. Therefore, the ENX’s multiplier equals 1 on the list.
For example, a multiplier of 100 would mean that the market is paying 100x more for a given explorer than ENX's current MCap/km2.
It would then be important to question why this is the case (refer to a sample list of questions above). This is also the most crucial part of the process, of not taking any numbers for granted.
As a result, we will all have our own adjusted MCap/km2 or multiplier for a given explorer based on our own knowledge, perspective and conviction.
I will just stop here as I have already covered this in my previous posts about ENX (Post #:53813272, Post #:53813586, and Post #:53816195).
Example: CHN-VMSJV SW Julimar look-alike project (Thor)
Here is a slideshared by Post #:53816505 and Post #:53739023 with a list of Julimar explorers:

VMS-CHN SWJulimar look-alike JV has a project area of 256km2.
Based on CHN’s MCap/km2 of 1.565, the market cap would be $400M if this Julimar look-alike is equivalent to the Julimar discovery. (VMS 30% = $120M). The target market cap for VMS could then be determined by adding other projects such as iron ore, tin, Kulin etc.
Again, extreme caution needs to be taken with this approach, given that many arguments and assumptions can significantly change the output.
For instance, if it isn’t commercially viable, the output would be zero. In contrast, CHN is valued at $3bn+; what makes up that $3bn and is $400m still a fair answer? What would the result be if a different MCap/km2 benchmark is used? etc. etc.
Conclusion
Whilst this is not rocket science, it does take effort and careful consideration to challenge these numbers to produce insights.
Like a knife, it can cut potatoes to make hand-cut chips, or it could kill if not handled cautiously.
Great explanation and I will also have a go.
By the way, potatoes do not stop growing during public holidays! Just joking.
JLC
---
Disclaimer – All in my opinion only and not financial/investment advice. I have zero nada geology knowledge, and this is my attempt in learning about the explorers. Always do your own research and question what you see.
A quick and dirty way of benchmarkingThere are many ways to benchmark these explorers, and one way would be to look at the market cap (Mcap)per project area.
This concept is similar to the property market by comparing land prices across different suburbs in dollar per square meter ($/sqm).
However, extreme caution must be taken when using the tables below, as each explorer is unique with countless assumptions that could influence its market cap, project area, and subsequently MCap/km2.
The purpose of this table (thanks to @Maxi II again) is to help investors, like myself, to ask better questions, and attempt to better understand the underlying assumptions which impact these explorers. For examples,
What observations could we draw from these values?
Why does the market pay a higher MCap/km2 for some explorers than others? What do they have in common?
For anomalies, are both market cap and project area being shown correctly in this table? i.e. does the market cap actually include other projects? Is this a JV project? (e.g. VMS’s market cap also include other projects and it is a JV with CHN; therefore, MCap/km2 needs to be re-adjusted)
What factors and assumptions would have a positive impact (or negative) on these values?
Does drilling commencement have an impact on MCap/km2?
Where are these explorers? Does the market pay different MCap/km2 for different regions? (i.e. Julimar vs others)
Based on other information and data, what is then the fair adjusted MCap/km2 for a given explorer? Why? Why not?
How do the explorers compare with their project areas and the assumed % of the success rate in making a discovery? How is this being reflected by their MCap/km2?
Whilst this should not be the sole benchmark or analysis to rely upon, this can help us in building our own hypothesis, to triangulate with other information/research/analysis, and ultimately better understanding them to increase our odds of identifying market mispricing.
Multiplier (to ENX) Post #:53802308
The context of the multiplier column is to illustrate how much more the market is currently paying for, in MCap/km2, of other PGE explorers vs the baseline of ENX. Therefore, the ENX’s multiplier equals 1 on the list.
For example, a multiplier of 100 would mean that the market is paying 100x more for a given explorer than ENX's current MCap/km2.
It would then be important to question why this is the case (refer to a sample list of questions above). This is also the most crucial part of the process, of not taking any numbers for granted.
As a result, we will all have our own adjusted MCap/km2 or multiplier for a given explorer based on our own knowledge, perspective and conviction.
I will just stop here as I have already covered this in my previous posts about ENX (Post #:53813272, Post #:53813586, and Post #:53816195).
Example: CHN-VMSJV SW Julimar look-alike project (Thor)
Here is a slideshared by Post #:53816505 and Post #:53739023 with a list of Julimar explorers:
VMS-CHN SWJulimar look-alike JV has a project area of 256km2.
Based on CHN’s MCap/km2 of 1.565, the market cap would be $400M if this Julimar look-alike is equivalent to the Julimar discovery. (VMS 30% = $120M). The target market cap for VMS could then be determined by adding other projects such as iron ore, tin, Kulin etc.
Again, extreme caution needs to be taken with this approach, given that many arguments and assumptions can significantly change the output.
For instance, if it isn’t commercially viable, the output would be zero. In contrast, CHN is valued at $3bn+; what makes up that $3bn and is $400m still a fair answer? What would the result be if a different MCap/km2 benchmark is used? etc. etc.
Conclusion
Whilst this is not rocket science, it does take effort and careful consideration to challenge these numbers to produce insights.
Like a knife, it can cut potatoes to make hand-cut chips, or it could kill if not handled cautiously.


