


Barkerville Gold Mines Ltd. wird zum Produzenten - 500 Beiträge pro Seite (Seite 17)
eröffnet am 20.01.10 17:37:37 von
neuester Beitrag 02.12.19 21:08:14 von
neuester Beitrag 02.12.19 21:08:14 von
Beiträge: 8.425
ID: 1.155.439
ID: 1.155.439
Aufrufe heute: 0
Gesamt: 664.741
Gesamt: 664.741
Aktive User: 0
ISIN: CA0676421088 · WKN: A0YJSZ
0,2750
EUR
0,00 %
0,0000 EUR
Letzter Kurs 25.11.19 Lang & Schwarz
Barkerville intersects 13.03 g/t Au over 9.10 metres at Island Mountain and provides corporate update
http://www.stockhouse.com/news/press-releases/2017/02/10/bar…
http://www.stockhouse.com/news/press-releases/2017/02/10/bar…
Antwort auf Beitrag Nr.: 54.026.744 von senna7 am 06.01.17 16:16:54
PR mäßig läuft ja einiges. 6 + vermutlich bald 2 weitere Rigs sollten den Newsflow hoch halten.
Hat jemand eine Übersicht, wie es cashmäßig aussieht?
Die letzte offizielle Info auf Sedar ist relativ alt, von Mitte letzten Jahres. Da waren ca. 13 Mio CAD verfügbar.
die PP von Nov und Dez sollten nochmal ca. 22 Mios in die Kassen gespült haben. Gibt es ggf. genauere Infos?
Wie ist das mit der Mill? Kann die eingesetzt werden? Weiß man etwas über Anlaufkosten?
Vielen Dank schon vorab, falls jemand Infos weitergeben kann/möchte.
Scheint
ja ganz interessant hier. Habe mir mal die HP, Sedar und Consorten angesehen. PR mäßig läuft ja einiges. 6 + vermutlich bald 2 weitere Rigs sollten den Newsflow hoch halten.
Hat jemand eine Übersicht, wie es cashmäßig aussieht?
Die letzte offizielle Info auf Sedar ist relativ alt, von Mitte letzten Jahres. Da waren ca. 13 Mio CAD verfügbar.
die PP von Nov und Dez sollten nochmal ca. 22 Mios in die Kassen gespült haben. Gibt es ggf. genauere Infos?
Wie ist das mit der Mill? Kann die eingesetzt werden? Weiß man etwas über Anlaufkosten?
Vielen Dank schon vorab, falls jemand Infos weitergeben kann/möchte.
Insiderverkäufe 13.02 - 100.153$
Insiderverkäufe 13.02 - 100.153$lt.
http://app.tmxmoney.com/research/insidertradesummaries?local…
cash 31 Mio$ (Stand Februar 2017)
Auf der Barkerville Homepage gibt es eine aktuelle und sehr informative Präsentation.http://www.barkervillegold.com/assets/docs/ppt/corporate-upd…
Die 800t/day Mühle wurde für 2,5 Mio$ modernisiert und steht bereit für den Beginn der Produktion im 2. Quartal 2017. Sie hat einen hoch entwickelten Sorter, der die Effizienz steigert.
Dafür wird die BC Vein underground mit einem neuen Road Header ausgebeutet.
Alle Permits dafür und auch ein Native Agreement sind eingetütet.
Zusätzlich will BGM 130000 m mit mehreren Riggs explorieren um im Laufe des Jahres eine neue Resourcenschätzung fertigzustellen.
Sprott, Osisko und Osisko Royalties besitzen über 50% der Anteile. Damit und mit dem neuen Management schlafe ich hervorragend und bin mit dieser Aktie bestens aufgestellt für die kommenden Jahre. Ob BGM mal übernommen wird, oder aber aus eigener Kraft wächst, ist da schon fast zweitrangig. Das Gebiet ist rießig, nur ein paar Prozent davon sind bisher exploriert.
Meine Devise war auch immer : follow the money, hat bisher oft sehr gut geklappt.
Antwort auf Beitrag Nr.: 54.328.744 von Goldbarren999 am 15.02.17 17:56:48
Seitwärts
Bin nun auch seit gut einer Woche dabei und bin positiv gestimmt. Wir befinden uns gerade in einer schon länger andauernden Seitwärtsbewegeung. Hoffe natürlich, dass diese bald zu Ende ist und es weiter aufwärts geht. Trading Spotlight
Antwort auf Beitrag Nr.: 54.348.031 von kubisander22 am 17.02.17 15:02:12
http://www.barkervillegold.com/assets/docs/nr/2017-02-22-nr.…
Neue Bohrresultate
Neue Bohrresultate wurden veröffentlicht. Bisher keine grossen Bewegungen im Kurs.http://www.barkervillegold.com/assets/docs/nr/2017-02-22-nr.…
Antwort auf Beitrag Nr.: 54.403.393 von kubisander22 am 24.02.17 13:40:32
Möglicherweise hilft der Goldpreis den Kurs etwas auf die Sprünge.
Seitwärts
erwarte mal kurzfristig nicht zu viel. Ziel ist eine erfolgreiche Exploration und starke Ressourcenschätzung ende des Jahres.Möglicherweise hilft der Goldpreis den Kurs etwas auf die Sprünge.
Antwort auf Beitrag Nr.: 54.404.272 von lale93 am 24.02.17 14:53:41
http://www.barkervillegold.com/assets/docs/ppt/bgm_corpupdat…
Das Managemet
ist schon beachtlich. Die haben schon mal was geschafft und arbeiten m. M. nach an weiteren großen Dingen
http://www.barkervillegold.com/assets/docs/ppt/bgm_corpupdat…
BGM Intersects 9.34 g/t Au Over 5.40 Metres At Island Mountain
http://www.barkervillegold.com/investors/news/bgm-intersects…
http://www.barkervillegold.com/investors/news/bgm-intersects…
Und schon wieder News aus den Bohrprojekten...
"...Barkerville Gold Mines Ltd. meldete heute neue Ergebnisse des Bohrprogramms am Zielgebiet Island Mountain auf dem Goldprojekt Cariboo in British Columbia, Kanada. Im Rahmen des Explorationsprogramms sollen Bohrlöcher mit einer Gesamtlänge von 130.000 m abgeteuft werden, um das Gebiet Island Mountain besser zu erkunden und die Ausdehnung der Mineralisierungen festzustellen.
Zu den Höhepunkten der jüngsten Ergebnisse zählen nach Angaben von Bakerville Gold Mines:
• Bohrloch IM-17-036: 16,96 g/t Au über 5,15 m
• Bohrloch IM-17-037: 6,26 g/t Au über 16,20 m
• Bohrloch IM-17-038: 12,30 g/t Au über 7,50 m
• Bohrloch IM-17-040: 5,20 g/t Au über 19,90 m
• Bohrloch IM-17-041: 5,60 g/t Au über 8,95 m......"
Quelle: 21.03.2017 - MinenPortal.de
 Bei den Grades werden die Mühlen ab dem 2.Quartal 2017 aber knackig zu tun haben.
Ich denke, der entscheidende Chartausbruch nach oben kommt noch vor den Sommerferien.
Ampel sind bei dem Cashbestand auf grün....

Antwort auf Beitrag Nr.: 54.586.224 von iwanowski am 22.03.17 08:39:16Der Kurs zeigt immerhin wieder eine etwas aufwärts gerichtete Tendenz. Ich glaube der grösste Schub könnte vorerst mal durch die Inbetriebnahe der Produktion kommen. Dazu folgendes aus dem Investor Magazin:
Trotz der guten Bohrergebnisse scheint die Aktie wie festgenagelt zu sein. Grund: Die angekündigte Produktion läuft noch nicht. Wie wir von Kontakten in Toronto erfahren konnten, verhandelt man derzeit mit den Behörden über die Höhe des zu hinterlegenden Bonds, der für die Wiederherstellung der verwendeten Landfläche hinterlegt werden muss. Gleichzeitig arbeitet man an der Feinjustierung der Anlage und merzt dabei Kinderkrankheiten beim Crusher und Oresorter aus. Wenn auch mit Verzögerung: die Aktie bleibt ein Topfavorit 2017.
Quelle: Investor Magazin
Na dann hoffen wir mal, dass die Produktion schon bald anläuft.
Antwort auf Beitrag Nr.: 54.594.459 von kubisander22 am 23.03.17 07:53:42
http://www.barkervillegold.com/investors/news/barkerville-ag…
Osisko
Barkerville Agrees to Sell 0.75% NSR Royalty on its Cariboo Gold Project for $12,500,000http://www.barkervillegold.com/investors/news/barkerville-ag…
Antwort auf Beitrag Nr.: 54.619.922 von kubisander22 am 27.03.17 14:16:12Die Meldung scheint wohl Positiv am Markt angekommen zu sein. Der Kurs hat schön angezogen. Hoffen wir jetzt ziehen wir weiter konstant nach oben...
Ich weiss nicht mehr, wie hoch der Cashbestand im Jahresbericht 2016 war, aber er schien ganz ordentlich zu sein.
Warum nunmehr wieder Cash gegen Royalities mit Osisko vereinbart wurde, erschließt sich mir nicht so recht.
Spätere Übernahme eventuell schon mal verfestigen?
I don´t know....aber ziemlich spannend wird es alle Mal.
Warum nunmehr wieder Cash gegen Royalities mit Osisko vereinbart wurde, erschließt sich mir nicht so recht.
Spätere Übernahme eventuell schon mal verfestigen?
I don´t know....aber ziemlich spannend wird es alle Mal.
Antwort auf Beitrag Nr.: 54.624.275 von iwanowski am 28.03.17 07:58:13Ich könnte mir auch vorstellen, dass sich Osisko schon mal was für die Zukunft sichern möchte. Vielleicht haben Sie sich gedacht, dass es jetzt noch günstig ist es nur noch teurer wird...
Die Aktie könnte 2017 tatsächlich zum Überflieger werden. Wie du gesagt hast, es wird spannend!
Die Aktie könnte 2017 tatsächlich zum Überflieger werden. Wie du gesagt hast, es wird spannend!
Antwort auf Beitrag Nr.: 54.627.434 von kubisander22 am 28.03.17 14:31:53Das war doch heute mal eine Ansage in Kanada! + 9.47%!!!
Antwort auf Beitrag Nr.: 54.631.325 von kubisander22 am 28.03.17 22:33:45Und hier könnte die Ursache dafür liegen:
BGM Intersects 24.70 G/T Au Over 6.60 Metres At Depth On Island Mountain / March 28th, 2017
http://www.barkervillegold.com/investors/news/bgm-intersects…
Quelle barkervillegold.com
Momentan überhäuft uns Barkerville mit News :-)
BGM Intersects 24.70 G/T Au Over 6.60 Metres At Depth On Island Mountain / March 28th, 2017
http://www.barkervillegold.com/investors/news/bgm-intersects…
Quelle barkervillegold.com
Momentan überhäuft uns Barkerville mit News :-)
Antwort auf Beitrag Nr.: 54.631.343 von kubisander22 am 28.03.17 22:36:16
einfach nur
Super GEIL
Antwort auf Beitrag Nr.: 54.639.032 von lale93 am 29.03.17 20:52:55
Bei Barkerville Gold Mines geht es voran. Zwar wartet man noch immer auf die Erteilung der finalen Genehmigung zur Aufnahme der Produktion, doch die Richtung stimmt. Jüngst hat man eine weitere Royalty an Osisko Gold Royalties verkauft. Zu den bereits im Besitz von Osisko befindlichen 1,5% NSR (Net-Smelter Royalty) kommen nun für 12,5 Mio. CAD weitere 0,75% hinzu. Wir spekulieren nun, dass ein Teil der eingenommenen Mittel für einen Reclamation–Bond, eine zu hinterlegende Bürgschaft zur Wiederherstellung des Landes nach der Schließung der Mine, verwendet werden könnte. Sobald die Mittel hinterlegt sind, wäre der Weg frei für die Erteilung der letzten Genehmigung. Warten wir es einmal ab. In der Zwischenzeit hat man abermals exzellente Bohrergebnisse aus dem laufenden Programm vorgelegt. Highlight dabei: 24,7 Gramm Gold pro Tonne über eine Länge von 6,6 Metern. Die Aktie konnte daraufhin alleine gestern 9,5% zu legen. Unser Toptipp 2017 ist zurück in der Spur. Weiter ein klarer Kauf.
Quelle: Investor Magazin / http://investor-magazin.de/download/investor-magazin_2017/In…
Bericht aus dem Investor Magazin
Osisko baut Einfluss aus, Aktie schafft AusbruchBei Barkerville Gold Mines geht es voran. Zwar wartet man noch immer auf die Erteilung der finalen Genehmigung zur Aufnahme der Produktion, doch die Richtung stimmt. Jüngst hat man eine weitere Royalty an Osisko Gold Royalties verkauft. Zu den bereits im Besitz von Osisko befindlichen 1,5% NSR (Net-Smelter Royalty) kommen nun für 12,5 Mio. CAD weitere 0,75% hinzu. Wir spekulieren nun, dass ein Teil der eingenommenen Mittel für einen Reclamation–Bond, eine zu hinterlegende Bürgschaft zur Wiederherstellung des Landes nach der Schließung der Mine, verwendet werden könnte. Sobald die Mittel hinterlegt sind, wäre der Weg frei für die Erteilung der letzten Genehmigung. Warten wir es einmal ab. In der Zwischenzeit hat man abermals exzellente Bohrergebnisse aus dem laufenden Programm vorgelegt. Highlight dabei: 24,7 Gramm Gold pro Tonne über eine Länge von 6,6 Metern. Die Aktie konnte daraufhin alleine gestern 9,5% zu legen. Unser Toptipp 2017 ist zurück in der Spur. Weiter ein klarer Kauf.
Quelle: Investor Magazin / http://investor-magazin.de/download/investor-magazin_2017/In…
Antwort auf Beitrag Nr.: 54.640.268 von kubisander22 am 30.03.17 07:11:37
In dem Fall wird nur umgesetzt, was sowieso geplant war. Zur Aufnahme der Produktion kann der zusätzliche Cash nicht schaden.
Bei dieser Aktie spielt im Moment die Musik. Ansatz zu einer Neubewertung. IMHO
um BGM
wird ja aktuell viel geschrieben. Zu der zusätzlichen NSR für Osisko hatte ich neulich gelesen, dass die zusätzlichen 0,75 % für Osisko sowieso optioniert waren. Leider habe ich den Link nicht mehr.In dem Fall wird nur umgesetzt, was sowieso geplant war. Zur Aufnahme der Produktion kann der zusätzliche Cash nicht schaden.
Bei dieser Aktie spielt im Moment die Musik. Ansatz zu einer Neubewertung. IMHO
BGM Corporate Update
TORONTO, ON – March 30, 2017. Barkerville Gold Mines Ltd. (TSXV: BGM) (“BGM”, or the “Company”) announces that Mr. Greg Gibson has tendered his resignation today as a Director and Co-Chairman of the Company. Mr. Sean Roosen will continue as sole Chairman of the Company.Mr. Gibson, along with the backing of Sprott Mining led by Mr. Eric Sprott, led the restructuring of BGM at a critical time and successfully set the subsequent stage for the current development of the Company, paving the way forward for the advancement of the BGM project to return to producer status.
Mr. Chris Lodder, President and CEO of BGM commented: “On behalf of the Board of Directors and management of BGM, we would like to thank Greg and Sprott Mining for their invaluable contributions to advancing the project to this stage. We look forward to completing their vision by our goal of bringing BGM back to successful producer status in short order.”
Mr. Sean Roosen, Chairman of the Board added: “We are very grateful for the hard work done by Greg and the Sprott group, without their participation and cooperative spirit BGM wouldn’t be at the advanced stage that it is at today. With further rapid advancement of the project, we are confident that BGM will become Canada’s newest gold producer in 2017.”
Quelle: http://www.barkervillegold.com/investors/news/bgm-corporate-…
Antwort auf Beitrag Nr.: 54.649.070 von kubisander22 am 31.03.17 07:23:44
OR und OM können nun bei Barkerville "durchregieren" und das bewährte Muster durchziehen.
Drillen bis die Bohrer kochen und Ressourcen ausdehnen.
Für die nahe und mittlere Zukunft ist Cash da. Die Produktion ist sicherlich ein Sahnestück, sofern das nach Wunsch funktioniert!
Der Wechsel
im Management hängt damit zusammen, dass Sprott für OR die Aufgabe erfüllte hat. Mit dem Verkauf der Anteile von Sprott an OR wurde sozusagen auch der Statthalter abgezogen.OR und OM können nun bei Barkerville "durchregieren" und das bewährte Muster durchziehen.
Drillen bis die Bohrer kochen und Ressourcen ausdehnen.
Für die nahe und mittlere Zukunft ist Cash da. Die Produktion ist sicherlich ein Sahnestück, sofern das nach Wunsch funktioniert!
Osisko übernimmt Kontrolle bei Barkerville Gold Mines
http://investor-magazin.de/3158osisko-uebernimmt-kontrolle-b…
http://investor-magazin.de/3158osisko-uebernimmt-kontrolle-b…
Bei den zu erwartenden Konstellationen wird es ja fast wieder Zeit unser damaliges Tippspiel in´s Leben zurückzurufen.
Erinnert sich noch jemand?
Die neuaufgelegte Frage müßte somit lauten:
Wo liegt der Wert der Barkerville-Aktie am 31.12.2017?
Ich meine mein damaliger Tipp waren 3,12€....werde mal der Einfachheit halber bei der Aussage bleiben...
Schöwo aus Niedersachsen
Erinnert sich noch jemand?
Die neuaufgelegte Frage müßte somit lauten:
Wo liegt der Wert der Barkerville-Aktie am 31.12.2017?
Ich meine mein damaliger Tipp waren 3,12€....werde mal der Einfachheit halber bei der Aussage bleiben...
Schöwo aus Niedersachsen
Gibts hier eigentlich schon eine Resourcenschätzung oder gar eine PEA/FS ?
Damals hat man sich ja ein wenig überschätzt
Damals hat man sich ja ein wenig überschätzt
Antwort auf Beitrag Nr.: 54.652.913 von JamesMcFly am 31.03.17 15:26:44
Da man mitten im Bohrprogramm ist, wäre "Patience" angesagt.
Mein persönlicher Tip wäre auf die neue Ressourcenschätzung in 6 - 12 Monaten zu warten, und mir dann die Shares zu deutlich erhöhten Kursen abzukaufen
@ Senna,
danke für den Tip!
Alles schön der Reihe nach
Ressourcenschätzung macht nicht vor oder während des Bohrprogramms Sinn, sondern nur danach.Da man mitten im Bohrprogramm ist, wäre "Patience" angesagt.
Mein persönlicher Tip wäre auf die neue Ressourcenschätzung in 6 - 12 Monaten zu warten, und mir dann die Shares zu deutlich erhöhten Kursen abzukaufen

@ Senna,
danke für den Tip!
noch 10 % dann bin ich erst mal pari

Es gab doch damals schon eine Resourcenschätzung. Was ist denn daraus geworden?
Antwort auf Beitrag Nr.: 54.660.791 von JamesMcFly am 02.04.17 15:50:27Würde mich auch interessieren, was aus den Superzahlen von "Spezi Frank" Callaghan und Adlatus Peter George geworden ist.
Die damalige, mit mehr als 10 Mio. Unzen angegebene und 90 Mio. Unzen abgeleitete Resource, hielt uns ja lange in Atem....bevor seriöse Untersuchungen für mächtig Ernüchterung sorgten.
Im Originalton eine Stellungnahme zur Aufarbeitung durch die Aufsichtsbehörden:
"...It took a long time, but they have finally finished their work. The new numbers are significantly lower, but in Mr. Callaghan’s view they prove Mr. George was on the right track.
One of the BCSC’s biggest problems with the stated 10.6 million ounces was that it was an “unconstrained” resource, meaning it incorporated drill holes well outside of the core deposit. That is not the accepted way to report a mineral resource estimate in Canada, and Mr. Callaghan acknowledged the error.
Snowden and Apex calculated Barkerville’s resource in a “constrained” model and came up with an indicated resource of one million ounces of gold, along with an inferred resource of four million ounces. Mr. George’s original report also included a “constrained” resource; in that scenario, he added up 4.2 million indicated ounces and 3.2 million inferred ounces..."
Quelle:
business.financialpost.com/news/mining/junior-miner-barkerville-admits-gold-estimates-for-one-of-its-b-c-projects-were-way-off - 24.06.2013
hier wird ein erstes Ziel von 1 Dollar genannt
Seite 10
http://cdn.ceo.ca.s3-us-west-2.amazonaws.com/1cdtocl-MMMar31…
Seite 10
http://cdn.ceo.ca.s3-us-west-2.amazonaws.com/1cdtocl-MMMar31…
Pariiii😨
Ab cirka der 4. Minute stellt Bußler in seiner heutigen Kolumne unser Schätzchen vor.
Guckst du hier:
http://www.wallstreet-online.de/video/9456644-busslers-gold-…
Guckst du hier:
http://www.wallstreet-online.de/video/9456644-busslers-gold-…
BGM receives permit for mining on Barkerville Mountain
http://www.newswire.ca/news-releases/bgm-receives-permit-for…
http://www.newswire.ca/news-releases/bgm-receives-permit-for…
Antwort auf Beitrag Nr.: 54.674.774 von senna7 am 04.04.17 17:23:16Die Meldung scheint nicht so gut am Markt angekommen zu sein 
Die Minenentwicklung läuft zwar bereits, doch man rechnet erst in ca. drei Monaten mit der ersten Verarbeitung des Materials. Etwas Verzögerung meiner Meinung nach. Wie seht ihr das?
Trotzdem sehe ich die Genehmigung als positiv obwohl wir nochmals ca. 3 Monate bis zum Produktionsstart warten müssen.
Ich behalte jedenfalls meine Shares noch eine Weile...
Sehe ich ähnlich.
Die Zeitverzögerung im Produktionsablauf hat den profesionellen Händlern in Kanada noch mal die Gelegenheit gegeben, den Kurs zu "managen".
Alles wird gut...ohmmmm.
Muss man halt eben noch mal die gegebene Chance zur Aufstockung nutzen.
Für die generellen Falschversteher der Zusatz: Dies ist keine Handelsaufforderung, nur eigen Meinung.
bei den Jahren wo ich dabei bin ...ist es mir völlig egal ...
mein Kursziel weiter min. 1 Dollar
mein Kursziel weiter min. 1 Dollar
Antwort auf Beitrag Nr.: 54.678.608 von senna7 am 05.04.17 09:09:16Erneut gute Bohrresultate!
BGM Intersects 31.22 G/T Au Over 7.50 Metres At Shaft Zone
http://www.barkervillegold.com/investors/news/bgm-intersects…
BGM Intersects 31.22 G/T Au Over 7.50 Metres At Shaft Zone
http://www.barkervillegold.com/investors/news/bgm-intersects…
Ohhhh...
BGM Announces Mineral Resource Update at Barkerville Mountain to Support Bonanza Ledge Operations
http://www.barkervillegold.com/investors/news/bgm-announces-…" target="_blank" rel="nofollow ugc noopener">
http://www.barkervillegold.com/investors/news/bgm-announces-…
Es reihen sich News an News :-)
BGM Announces Mineral Resource Update at Barkerville Mountain to Support Bonanza Ledge Operations
http://www.barkervillegold.com/investors/news/bgm-announces-…" target="_blank" rel="nofollow ugc noopener">
http://www.barkervillegold.com/investors/news/bgm-announces-…
Es reihen sich News an News :-)
Es gibt übrigens eine aktualisierte Präsentation:
Corporate Update March 30 2017
http://www.barkervillegold.com/assets/docs/ppt/bgm_corpupdat…
Goldpreis sieht momentan auch erfreulich aus, denke heute könnte es nochmals einen schönen Schub nach oben geben bei Barkerville.
Corporate Update March 30 2017
http://www.barkervillegold.com/assets/docs/ppt/bgm_corpupdat…
Goldpreis sieht momentan auch erfreulich aus, denke heute könnte es nochmals einen schönen Schub nach oben geben bei Barkerville.
Hat jemand die Aufstellung von unserer Kurschätzung? Denke, dass könnte hier noch sehr interessant werden. Ich habe mein Kursziel nicht mehr zur Hand.
lg
hbc002
lg
hbc002
Antwort auf Beitrag Nr.: 54.698.528 von hbc002 am 07.04.17 17:01:26
ich habe mein Kursziel nicht mehr zur Hand
Geht's noch, kann jemand mal den Beitrag löschen!
Antwort auf Beitrag Nr.: 54.700.349 von lale93 am 07.04.17 21:54:13... und welche Laus ist Ihnen über die Leber gelaufen, wenn man fragen darf? Bin mir nicht sicher, ob ich damals mitgemacht habe beim Tipspiel, aber die Frage nach den ursprünglichen Tips ist doch nun wirklich nichts, was man löschen muss?!
einfach schön in der Osisko Gruppe zu sein
http://www.finanznachrichten.de/nachrichten-2017-04/40415376…
http://www.finanznachrichten.de/nachrichten-2017-04/40415376…
Antwort auf Beitrag Nr.: 54.714.534 von senna7 am 11.04.17 08:33:09Aus gleichnamigem Text:
"...Osisko Gold Royalties hält 116.372.506 Stammaktien von BGM (35,2 %). Diese Aktien hatten am 7. April 2017 einen Marktwert von ungefähr 85,0 Millionen $, was einem Plus von rund 36,3 Millionen $ gegenüber dem ursprünglichen Kaufpreis entspricht. Osisko Gold Royalties verfügt zudem über eine NSR-Lizenzbeteiligung von 2,25 % an der Liegenschaft von BGM..."
Haben ja bis jetzt auch nicht schlecht -nur durch den Zukauf- verdient...
Aber hast recht, jetzt ist Zug drin und nach dem Ende des derzeit laufenden Bohrprogramm sehen wir sicherlich schon mal kurz den Cad (nur meine eigene Meinung).
Also: Alle schön dabei bleiben und ein kräftiges -Glückauf- !!
Barkerville sees long-term potential in BC’s Cariboo gold district (aus The Northern Miner)
http://www.northernminer.com/news/barkerville-sees-long-term…Viel Spaß beim lesen.
Antwort auf Beitrag Nr.: 54.720.540 von bre128 am 11.04.17 20:44:09Könnt ihr den Beitrag von oben lesen? Bei mir geht das nicht...braucht man da ein Abo?
Heute wieder ganz schöne Kursentwicklung!
Heute wieder ganz schöne Kursentwicklung!
BGM INTERSECTS 15.04 G/T AU OVER 8.05 METRES AT SHAFT ZONE
http://www.barkervillegold.com/investors/news/bgm-intersects…
Der Newsflow geht konstant weiter...die bohren was das Zeug hält :-)
Komisch...beim Link von Northen Miner kommt bei mir immer folgende Meldung obwohl ich da noch nie einen Artikel gelesen habe.
"You have reached your limit of free weekly articles. You will receive access to another article next week."
Könnte evtl. jemand den ganzen Text hier reinstellen? Vielen Dank!
Antwort auf Beitrag Nr.: 54.722.130 von kubisander22 am 12.04.17 07:44:55Konnte den Artikel auf Northen Miner nun doch lesen. Bin einfach über die Hauptseite zum Artikel gestossen, dann kam die Meldung nicht mehr.
oder die Überschrift in Google eingeben dann gehts auch ....
Danke Senna7 für den tollen Support.
Hat ja doch eine "Weile" gedauert vom Explorer zum Producer.
Aber endlich kommen wir dem Ziel näher. Viele Grüße
Hat ja doch eine "Weile" gedauert vom Explorer zum Producer.
Aber endlich kommen wir dem Ziel näher. Viele Grüße
Antwort auf Beitrag Nr.: 54.726.078 von senna7 am 12.04.17 15:47:19Die Aktie macht mir momentan sehr grosse Freude! Ich frage mich welchen Wert die Aktie noch erreichen kann? Sehr schwierige Frage ich weiss Bin aktuell fett im Plus (+ 60%) glaube aber, dass es aktuell noch zu früh ist schon wieder zu verkaufen.
Wie seht ihr das so und seid ihr überhaupt investiert?
Ich bin mir sicher, dass wir dieses Jahr (vielleicht schon bis Sommer, wenn es so weitergeht) die 1 Doller Marke noch knacken werden.
Bin aktuell fett im Plus (+ 60%) glaube aber, dass es aktuell noch zu früh ist schon wieder zu verkaufen.Wie seht ihr das so und seid ihr überhaupt investiert?
Ich bin mir sicher, dass wir dieses Jahr (vielleicht schon bis Sommer, wenn es so weitergeht) die 1 Doller Marke noch knacken werden.
Das sind keine Kleinanleger.
So schnell mal 100 k weg zu 0,85 CAD.
12.04.2017 16:04:27 0,85 106.500
So schnell mal 100 k weg zu 0,85 CAD.
12.04.2017 16:04:27 0,85 106.500
@ kubis
ich bin schon seit über 7 Jahre dabei und habe viele Höhen & Tiefen schon mitgemacht ...einfach den Thread am Anfang mal durchsuchen ...
es gab auch mal den Namen Wayside .....
vielleicht werden nun noch meine damiligen Hoffungen wahr ( die lagen bei mehreren Dollar )
ich bin schon seit über 7 Jahre dabei und habe viele Höhen & Tiefen schon mitgemacht ...einfach den Thread am Anfang mal durchsuchen ...
es gab auch mal den Namen Wayside .....
vielleicht werden nun noch meine damiligen Hoffungen wahr ( die lagen bei mehreren Dollar
)Einfaches Einfügen von wallstreetONLINE Charts: So funktionierts.
Bin raus, war wahrscheinlich falsch, aber, wer weiss das schon, Gewinne sind immer gut...
Antwort auf Beitrag Nr.: 54.728.211 von ooy am 12.04.17 19:54:39
gratuliere!
Gewinne sind nie verkehrt. Darf ich fragen, was als nächstes ansteht, oder Seitenlinie?
Antwort auf Beitrag Nr.: 54.729.000 von lale93 am 12.04.17 22:09:07Hier auf jeden Fall Seitenlinie, aber Euch viel viel Erfolg...
Das wird noch eine heisse Kiste...eigentlich ist gestern mit dem Goldpreis keine besondere Bewegung einhergegangen, aber Barkerville legt in der Spitze fast 16% zu und gibt bis zum Handelsschluss in Kanada wieder 12% ab.
Warm anziehen, Freunde und sich über das vermeindliche Interesse eines immer größer werdenden Käuferkreises freuen.
Da kommt noch Großes....
Warm anziehen, Freunde und sich über das vermeindliche Interesse eines immer größer werdenden Käuferkreises freuen.
Da kommt noch Großes....
Antwort auf Beitrag Nr.: 54.729.861 von iwanowski am 13.04.17 07:42:51
Da scheint ja der nächste charttechnische Wiederstand. Wenns da drüber geht, sind deutlich höhere Goldkurse drin. Das würde auch die Explorer zusätzlich anheizen. Dann aber m.E. alle Explorer. Auch die M&A Tätigkeit würde dann deutlich zunehmen...
Alles schon dagewesen
Der Goldpreis wird wieder interessant
jenseits der 1313USD.Da scheint ja der nächste charttechnische Wiederstand. Wenns da drüber geht, sind deutlich höhere Goldkurse drin. Das würde auch die Explorer zusätzlich anheizen. Dann aber m.E. alle Explorer. Auch die M&A Tätigkeit würde dann deutlich zunehmen...
Alles schon dagewesen
Hey, die Hompage ist auch seit gestern auf dem neuesten Stand..
http://www.barkervillegold.com/
Sieht super aus...
http://www.barkervillegold.com/
Sieht super aus...
Antwort auf Beitrag Nr.: 54.729.945 von lale93 am 13.04.17 08:00:35Die aktuelle Widerstandszone bei Gold liegt eher bei 1290USD.
Zur Zeit gehts hier was .... vor 1 Monat hab ich noch mit den Kopf geschüttelt und wollte unter 50 Cent nachkaufen .... da aber alle Aktien liefen und BGM nicht , hatte ich ehrlich gesagt Angst das irgentwas faul ist ....
und ich denke auch da war was faul !!! .... nämlich das man den Kurs bewußt unten gehalten hat ....
und nun hat man BGM von der " LEINE " gelassen hat ....
man sieht es an den mächtigen Umsätzen bei steigenden Kursen , der Dollar ist bald da ....
und ich denke auch da war was faul !!! .... nämlich das man den Kurs bewußt unten gehalten hat ....
und nun hat man BGM von der " LEINE " gelassen hat ....
man sieht es an den mächtigen Umsätzen bei steigenden Kursen , der Dollar ist bald da ....
Erst eine gute Stunde gehandelt und bereits über 2,15 Mio. Shares haben den Besitzer gewechselt.... unbelieveable
Antwort auf Beitrag Nr.: 54.734.325 von iwanowski am 13.04.17 16:51:00Unglaublich wie Barkerville unter hohen Umsätzen nach oben schiesst.
Da werden jetzt natürlich viele Daytrader auf den Zug aufgesprungen sein, bzw. aufspringen.
D.h. es wird zu Rückschlägen kommen und dann kommt es auf die Bigplayer an.
Wie ich schon geschrieben habe, zurücklehnen und genießen, wir haben uns vor ein paar Jahren
für die richtige Aktie entschieden, leider etwas zu früh.
So wie die Kanadier im Holzfällerforum stockhouse denke ich auch, daß der Kurs jetzt den Dollar sehen will... dann kanns natürlich auch erstmal heftig zurückgehen.
Aber das sind kurzfristige Ausschläge, die mich eigentlich nicht groß interessieren.
Das neue Managemant macht einen fantastischen Job, der Markt erkennt wohl mehr und mehr was in diesem rießigen Gebiet (67km x 25km!) alles möglich ist und mit Osisko haben wir einen erstklassigen Partner mit an Bord.
Antwort auf Beitrag Nr.: 54.734.562 von Goldbarren999 am 13.04.17 17:24:26Korr.: Management (man sollte sich halt immer noch mal den Text durchlesen)
Antwort auf Beitrag Nr.: 54.734.592 von Goldbarren999 am 13.04.17 17:27:14
Next Play: Beaufield
Wares ist schon da. Zwei wichtige Zonen aus der Windfall Area laufen rüber in deren Claims. Da sag ich nur "Vollgas", ohne Rücksicht auf mögliche Verluste.
und immer Gold im Auge behalten. Wo genau der Chartwiederstand liegt aber es gibt ihn. Kommt auf die Währung, Chartbild und den Zeichner an...
Krass!
Das ist m. E. erst der Anfang. Das Management operiert an mehreren Plays, das vervielfältigt sich. Die wissen was sie tun...Next Play: Beaufield
Wares ist schon da. Zwei wichtige Zonen aus der Windfall Area laufen rüber in deren Claims. Da sag ich nur "Vollgas", ohne Rücksicht auf mögliche Verluste.
und immer Gold im Auge behalten. Wo genau der Chartwiederstand liegt
 aber es gibt ihn. Kommt auf die Währung, Chartbild und den Zeichner an...
Antwort auf Beitrag Nr.: 54.733.824 von senna7 am 13.04.17 15:58:19Hi Senna, denke wird sind einer der letzten, die hier durchgehalten hatten. Auch ich bin nicht in der Lage gewesen, bei 40ccd nach zukaufen- der Mut war nicht vorhanden. Bei MTA Metalla Royalty and Streaming ist es mir gelungen bei 2 Cent eine Mio nach zufassen.
Hast Du noch die Liste von unserem Tippspiel. Da laufen wir auch hin - um die 4 Can es schon werden. Jetzt ist BGM um Jahre weiter und haben auch noch starke Player mit an Bord.
Mir ist nicht mehr bange um Barkerville, die Ressourcen werden schon da sein.
Frank G und der Geologe haben einige Mio Oz aufgeführt. Die Bohrergebnisse sind einfach gut.
lg
hbc002
Hallo hbc
leider ist die Liste auf meine alten PC gelegen und ich hab vergessen zu sichern ....sorry ...
zu meinen Bestand ...
ich bin nun mit ca 100 % im Plus, muss dazu aber sagen das ich erst mal einen Teil ausgestiegen bin ,mit Verlusten zum Gegenrechnen und dann wirklich am Tief wieder zugekauft habe ...
ALLES IN ALLEM wenn ich meine alten Verluste mit einrechne trotzdem noch mit ca 75 % im Plus ( Buchgewinn weil ich ja noch dabei bin und bleibe )
Ganz bin ich hier NIE RAUS weil ich immer noch denke das die alten Vorhersagen wenigstens eine Teil richtig sind und in nächster Zeit werden wir sehen
http://www.miningscout.de/kolumnen/2012/07/09/bedenken-mehre…
leider ist die Liste auf meine alten PC gelegen und ich hab vergessen zu sichern ....sorry ...
zu meinen Bestand ...
ich bin nun mit ca 100 % im Plus, muss dazu aber sagen das ich erst mal einen Teil ausgestiegen bin ,mit Verlusten zum Gegenrechnen
und dann wirklich am Tief wieder zugekauft habe ...ALLES IN ALLEM wenn ich meine alten Verluste mit einrechne trotzdem noch mit ca 75 % im Plus ( Buchgewinn weil ich ja noch dabei bin und bleibe )
Ganz bin ich hier NIE RAUS weil ich immer noch denke das die alten Vorhersagen wenigstens eine Teil richtig sind und in nächster Zeit werden wir sehen
http://www.miningscout.de/kolumnen/2012/07/09/bedenken-mehre…
Wer noch mehr über "früher " und den 90 Mio Unzen wissen will
einfach Herrn Google fragen ....
https://www.google.de/?gws_rd=ssl#q=barkerville+gold+Cow+Mou…
einfach Herrn Google fragen ....
https://www.google.de/?gws_rd=ssl#q=barkerville+gold+Cow+Mou…
Hab die Presi mal schnell überfolgen. Gibt es hier immer noch keine Resourcenschätzung?
Antwort auf Beitrag Nr.: 54.736.674 von hbc-002 am 13.04.17 23:37:02...gehöre auch noch zu den alten Säcken, die her immer noch am Ball sind.
Ich denke, die Ressource ist gigantisch und wurde damals "boykottiert damit andere Leute ans Ruder kommen. Muss ja nicht unbedingt schlecht sein. Für den "Schatz" braucht es auch die passenden Leute, die ihn heben können.
Ich denke, die Ressource ist gigantisch und wurde damals "boykottiert damit andere Leute ans Ruder kommen. Muss ja nicht unbedingt schlecht sein. Für den "Schatz" braucht es auch die passenden Leute, die ihn heben können.
Antwort auf Beitrag Nr.: 54.741.336 von Pyromorphit am 15.04.17 12:09:38Kannst Du Dich noch erinnern, als ich mal schrieb -in 2012, das Leute versuchen Frank die Aktien ab zukaufen -4,$ Can und FG wollte nicht abgeben. Somit hat man ihn einfach raus gedrängt.
E Sprott mit Ossisko und OS Royalty halten jetzt 51%.
Jetzt wird BGM sehr wertvoll gemacht. Gut das wir dabei sind.
Hast Du noch die Schätzliste aus 2012?
lg
hbc002
E Sprott mit Ossisko und OS Royalty halten jetzt 51%.
Jetzt wird BGM sehr wertvoll gemacht. Gut das wir dabei sind.
Hast Du noch die Schätzliste aus 2012?
lg
hbc002
!
Dieser Beitrag wurde von MODelfin moderiert. Grund: auf eigenen Wunsch des Users
Sind die knapp 180k unzen alles was bisher nachgewiesen wurden?
ich habe die Liste gefunden im Thread

Antwort auf Beitrag Nr.: 54.742.449 von senna7 am 15.04.17 19:56:45Ich hatte bei meinem Tipp irgendwas mit 12 Cad-cent im Hinterkopf.
Waren aber "nur" 2,12 statt letztens von mir genannte 3,12 Cad.
Eh Wurscht... beide Werte werden scheinbar dieses Jahr noch nach oben hin getopt.
Schöne Osterfeiertage an alle Beteiligten aus dem verregneten Niedersachsen.
Waren aber "nur" 2,12 statt letztens von mir genannte 3,12 Cad.
Eh Wurscht... beide Werte werden scheinbar dieses Jahr noch nach oben hin getopt.
Schöne Osterfeiertage an alle Beteiligten aus dem verregneten Niedersachsen.
na mit 4,50 liege ich doch gar nicht schlecht!!!
Nochmal schnell mit "rüberkopiert " die Tipps auf diese neue Seite , mal sehen wer noch dabei ist
uns sich meldet
zur Zeit hätte User " Rossoblue " die Wette gewonnen
uns sich meldet
zur Zeit hätte User " Rossoblue " die Wette gewonnen
Selbst in der USA sind wir angekommen.
Im Stockhouse Bullboard zu unserem Titel wird das "Deutsche Tippspiel" erwähnt und die Graphik ist auch rüberkopiert.
Mit der Bemerkung, dass selbst in Europa/Deutschland die Aktie nicht in Vergessenheit geriet, wird auf "da kommt noch mehr" spekuliert.
Im Stockhouse Bullboard zu unserem Titel wird das "Deutsche Tippspiel" erwähnt und die Graphik ist auch rüberkopiert.
Mit der Bemerkung, dass selbst in Europa/Deutschland die Aktie nicht in Vergessenheit geriet, wird auf "da kommt noch mehr" spekuliert.
Antwort auf Beitrag Nr.: 54.742.443 von JamesMcFly am 15.04.17 19:56:22
Eine weitere Ressourcenschätzung über das aktuell laufende Bohrprogramm macht aktuell keinen Sinn, da sie mitten drin sind.
die 180k
haben nur etwas mit der Produktion zu tun. Damit soll aufgezeigt werden, wie lange man die anlaufende Produktion mit den entsprechend dafür vorgesehenen Resourcen aus den kleinen genannten Gebiet bedienen kann. Mehr nicht.Eine weitere Ressourcenschätzung über das aktuell laufende Bohrprogramm macht aktuell keinen Sinn, da sie mitten drin sind.
Antwort auf Beitrag Nr.: 54.743.508 von senna7 am 16.04.17 09:41:45Danke Senna, auf dich ist wieder mal Verlass, meine 3,50 könnten schon nächstes Jahr erreicht werden. Wenn BGM einmal das ganze Bohrprogramm und eine neue RS machen, dann wird jeder erkennen, welch riesiges Goldreich sich dort befindet.
LG
hbc002
LG
hbc002
Antwort auf Beitrag Nr.: 54.743.862 von lale93 am 16.04.17 12:03:55
Ok, dann gibt es noch nicht wirklcih eine Reource. Was wurede denn die letzten 5 Jahre gemacht?
Zitat von lale93: haben nur etwas mit der Produktion zu tun. Damit soll aufgezeigt werden, wie lange man die anlaufende Produktion mit den entsprechend dafür vorgesehenen Resourcen aus den kleinen genannten Gebiet bedienen kann. Mehr nicht.
Eine weitere Ressourcenschätzung über das aktuell laufende Bohrprogramm macht aktuell keinen Sinn, da sie mitten drin sind.
Ok, dann gibt es noch nicht wirklcih eine Reource. Was wurede denn die letzten 5 Jahre gemacht?
Hallo Mc Fly !!! aufwachen 

und selbst mal lesen da kannst du die ganzen Jahre selbst zurückverfolgen ....
und nicht nur so humorlos fragen .... ( hört sich für mich etwas vorwurfvoll an ...)
http://www.barkervillegold.com/investors/news
und die " alten Geschichten " und ob du an die Vorkommen glaubst oder nicht kannst du gerne
hier im Thread lesen ....
und wenn ich die letzten Grade anschaut die man veröffentlicht hat
bin ich sehr zuversichtlich.

und selbst mal lesen
da kannst du die ganzen Jahre selbst zurückverfolgen ....und nicht nur so humorlos fragen .... ( hört sich für mich etwas vorwurfvoll an ...)
http://www.barkervillegold.com/investors/news
und die " alten Geschichten " und ob du an die Vorkommen glaubst oder nicht kannst du gerne
hier im Thread lesen ....
und wenn ich die letzten Grade anschaut die man veröffentlicht hat
bin ich sehr zuversichtlich.
Antwort auf Beitrag Nr.: 54.744.448 von senna7 am 16.04.17 16:44:24
Jetzt kanns losgehn, vor 5 Jahren wäre ich ja auch noch nicht dabei gewesen
Der große Durchblicker bin ich leider nicht in den Themen die da abgelaufen sind. Ich habe aber so das Gefühl, daß die Osisko Truppe eine Art "Elon Musk" der Explorerszene ist. In jedem Fall bekommen sie immer die Finanzen geregelt, und haben Leute hinter sich, die in dem was sie machen müssen Durchblick bewahren.
- Warum Tesla eine so extreme Bewertung hat??? Wenn man sich damit beschäftigt, kommt man unweigerlich drauf, dass es etwas mit "Glauben an dessen Visionen" zu tun hat.
So ist es auch hier, die Visionen scheinen sich mit dem OSK Team auf den verschiedenen Explorationen zu bewahrheiten. Man muss nur sehen, wie systematisch die Ressourcen mit immer besseren Graden "erbohrt" werden.
Schön dabei zu sein. Wichtig auch regelmäßig etwas einzucashen
was hat man die letzten 5 Jahre gemacht
vorbereitet.Jetzt kanns losgehn, vor 5 Jahren wäre ich ja auch noch nicht dabei gewesen
Der große Durchblicker bin ich leider nicht in den Themen die da abgelaufen sind. Ich habe aber so das Gefühl, daß die Osisko Truppe eine Art "Elon Musk" der Explorerszene ist. In jedem Fall bekommen sie immer die Finanzen geregelt, und haben Leute hinter sich, die in dem was sie machen müssen Durchblick bewahren.
- Warum Tesla eine so extreme Bewertung hat??? Wenn man sich damit beschäftigt, kommt man unweigerlich drauf, dass es etwas mit "Glauben an dessen Visionen" zu tun hat.
So ist es auch hier, die Visionen scheinen sich mit dem OSK Team auf den verschiedenen Explorationen zu bewahrheiten. Man muss nur sehen, wie systematisch die Ressourcen mit immer besseren Graden "erbohrt" werden.
Schön dabei zu sein. Wichtig auch regelmäßig etwas einzucashen
Tradingstop in Toronto ???
Was kommt da denn auf uns zu....
Was kommt da denn auf uns zu....

Antwort auf Beitrag Nr.: 54.747.436 von iwanowski am 17.04.17 15:50:48IIROC Trade Halt - Barkerville Gold Mines Ltd.
V.BGM | 28 minutes ago
Vancouver, British Columbia--(Newsfile Corp. - April 17, 2017) - The following issues have been halted by IIROC:
Company:
Barkerville Gold Mines Ltd.
TSX-V Symbol:
BGM
Reason:
At the Request of the Company Pending News
Halt Time (ET)
09:26
IIROC can make a decision to impose a temporary suspension of trading in a security of a publicly listed company, usually in anticipation of a material news announcement by the company. Trading halts are issued based on the principle that all investors should have the same timely access to important company information. IIROC is the national self-regulatory organization which oversees all investment dealers and trading activity on debt and equity marketplaces in Canada.
- 30 -
For further information: IIROC Inquiries 1-877-442-4322 (Option 3) - Please note that IIROC is not able to provide any additional information regarding a specific trading halt. Information is limited to general enquiries only.
Read more at http://www.stockhouse.com/news/press-releases/2017/04/17/iir…
BGM INTERSECTS 19.20 G/T AU OVER 54.40 METRES AND 11.42 G/T AU OVER 28.55 METRES AT SHAFT ZONE
April 17th, 2017
http://www.barkervillegold.com/investors/news/bgm-intersects…
Zitat :
Chris Lodder, President and CEO of Barkerville Gold Mines, comments, “These intersections are some of the best to date on Island Mountain that continues to produce new zones of higher grade, wide zones of gold mineralization. We will be following up with both wide spaced step out and closer infill drilling in this area to better determine dimensions of this potentially strongly mineralized vein corridor”.
Antwort auf Beitrag Nr.: 54.747.625 von senna7 am 17.04.17 16:42:54Na, wenn die guten Bohrergebnisse der Grund für den Stop waren, wird der Kurs ja bald das Fliegen lernen.
....und wir sind dabei
....und wir sind dabei
..und da bewegen sich die kleinen Flügelchen auch schon (knappe plus 20% momentan) .
2,4 Mio Stücke gingen ebenfalls bereits übern Tresen.
2,4 Mio Stücke gingen ebenfalls bereits übern Tresen.
Antwort auf Beitrag Nr.: 54.747.979 von iwanowski am 17.04.17 18:16:08Ach du heilige Scheisse :-) Was geht denn hier ab? Die News sind Klasse! Mein Depot ist am explodieren. Habe soeben meine erste 100% plus Aktie im Depot :-) Jetzt cool bleiben und meiner Meinung nach weiterhin dabei bleiben...
Antwort auf Beitrag Nr.: 54.748.507 von senna7 am 17.04.17 20:08:02
Schaut euch mal BFD an. Wird als nächstes explodieren. IMHO
Ohne Worte
das kann man nur genießen. Mal sehn, bei OSK hab ich mittlerweile ca. 20% abgebaut. Das geht leider nicht so schnell... Irgendwie hängt man dran. Schaut euch mal BFD an. Wird als nächstes explodieren. IMHO
Antwort auf Beitrag Nr.: 54.748.978 von lale93 am 17.04.17 22:36:52Moin,
hilf mir mal auf die Sprünge "BFD" steht für?
Gruß
abbi4
hilf mir mal auf die Sprünge "BFD" steht für?
Gruß
abbi4
Antwort auf Beitrag Nr.: 54.749.839 von abbi4 am 18.04.17 08:54:50Musste dies auch zuerst recherchieren :-)
BFD = Beaufield Resources Inc
http://www.beaufield.com/
BFD = Beaufield Resources Inc
http://www.beaufield.com/
Antwort auf Beitrag Nr.: 54.749.917 von kubisander22 am 18.04.17 09:02:28Danke,
warum sollte BFD auch durch die Decke gehen?
warum sollte BFD auch durch die Decke gehen?
bin gespannt auf heute Nachmittag / Abend -nun wo auch alle Osterhasen wieder dabei sind -
was sich kurstechnisch tut ES lebe unsere TIPSPIEL
was sich kurstechnisch tut
ES lebe unsere TIPSPIEL
Antwort auf Beitrag Nr.: 54.750.157 von senna7 am 18.04.17 09:32:17Bin auch sehr gespannt auf die Eröffnung heute in Kanada. Geht es weiter nach oben oder gibt es erst mal einen Rücksetzer um dann weiter zu steigen?
@lale93 und abbi4: Die Aktie von Beaufield Resources Inc ist ja bereits explodiert...
@lale93 und abbi4: Die Aktie von Beaufield Resources Inc ist ja bereits explodiert...
Was für ein Tagesanstieg gestern!
Durch die vielen guten und so wie gestern sogar hervorragenden Bohrergebnisse stellt sich Barkerville immer mehr in den Vordergrund und rückt in den Focus des Marktes. Der Markt realisiert immer mehr dass hier etwas Großes entstehen könnte, was wir schon seit 5 Jahren recht sicher waren, dass hier eine Monsterressource unter dem rießigen 65x25km Gebiet liegen könnte. Die Millionen Unzen an historisch gewonnen Placer Gold in diesem Gebiet müssen ja als Motherlode seinen Ursprung haben. Und Barkerville exploriert was die Rigs hergeben. Ein 130000m Bohrprogramm ist einfach nur toll.
Das damals von Peter George (ehemaliger BGM Geologe) genannte Potential von 90 Mio Unzen ist sicher sehr, sehr hoch gegriffen, aber schlussendlich ist jede Resourcenkalkulation eine Hochrechnung, die stimmen kann, oder aber nicht. Für die damalige Resourcenschätzung von ca. 10 Mio Unzen waren viel zu wenig Löcher gebohrt worden, weshalb die Behörde die Notbremse zog. Nun, mit neuem Management und viel mehr Kapital wird dies nachgeholt für zukünftige besser abgesicherte Resourcenschätzungen. Das Schwierige daran ist dass es ein nuggety Vorkommen ist, welches immer schwer abzuschätzen ist. Schlussendlich weiss man das erst wenn das Vorkommen durch die Mühle gejagt wird. Und genau das will Chris Lodder (CEO) mittels Untertagebetrieb (neuer Roadheader!) und runderneuerter Mühle angehen.
Wie ich schon mehrfach geschrieben habe: Ob Barkerville vorzeitig mit Premiumaufschlag übernommen wird, oder aber organisch wächst (mit neuer vergrößerter Mühle) ist völlig zweitrangig.
Hier ein deutscher Artikel zur Osisko Beteiligung vom 12.4.:
Der kanadische Förderzinsrechte-Spezialist Osisko Gold Royalties (ISIN: CA68827L1013 / TSX: OR) hat nach all den Zukäufen der vergangenen Wochen eine erste Zwischenbilanz gezogen und ein Update zu seinen zahlreichen Unternehmensbeteiligungen vorgelegt. Demnach lag der Gesamtbörsenwert des von der frankokanadischen Gesellschaft gehaltenen Investmentportfolios zum Stichtag 7. April 2017 bei rund 407,9 Mio. CAD. Bezahlt hat das Unternehmen hierfür jedoch nur etwa 233,2 Mio. CAD.
An dem hauptsächlich im historischen ‚Cariboo‘-Bergbaudistrikt im Herzen British Columbias operierenden Goldexplorer Barkerville Gold Mines (TSX-V: BGM) ist Osisko dagegen aktuell zu rund 35,2 % beteiligt. Der Börsenwert der etwa 116,4 Mio. Aktien lag Ende vergangener Woche bei 85 Mio. CAD und damit mehr als doppelt so hoch wie der ursprüngliche Erwerbspreis von 36,3 Mio. CAD. Barkerville führt derzeit ein 130.000 m-Bohrprogramm auf seinem ‚Bonanza Ledge‘-Vorkommen durch und will dort entsprechend einer jüngst erteilten Abbaugenehmigung künftig 150.000 Tonnen Erz pro Jahr im Untertagebetrieb fördern. Neben seiner Aktienbeteiligung verfügt Osisko auch noch über eine 2,25 %-‚NSR-Royalty‘ für Barkervilles Liegenschaften.
„Wir glauben, dass diese Projekte eine starke Plattform bieten werden, um zukünftige Einnahmen zu generieren“, zeigte sich Roosen zuversichtlich. Der kanadische Förderzinsrechte-Spezialist Osisko Gold Royalties (ISIN: CA68827L1013 / TSX: OR) hat nach all den Zukäufen der vergangenen Wochen eine erste Zwischenbilanz gezogen und ein Update zu seinen zahlreichen Unternehmensbeteiligungen vorgelegt. Demnach lag der Gesamtbörsenwert des von der frankokanadischen Gesellschaft gehaltenen Investmentportfolios zum Stichtag 7. April 2017 bei rund 407,9 Mio. CAD. Bezahlt hat das Unternehmen hierfür jedoch nur etwa 233,2 Mio. CAD. „Als Teil unseres Wertschöpfungsprozesses haben wir Kapital und Personal bereitgestellt, um Explorations- und Entwicklungsprojekte voranzutreiben“, erklärte Osikos Chairman und CEO Sean Roosen die Strategie seiner Gesellschaft. Außerdem habe man sich im Zuge der Investitionen Förderzins- (‚Royalties‘) und Vorkaufsrechte (‚Streams‘) für die künftige Produktion der jeweiligen Liegenschaften sowie das Recht zur Beteiligung an kommenden Finanzierungsrunden einräumen lassen. „Wir glauben, dass diese Projekte eine starke Plattform bieten werden, um zukünftige Einnahmen zu generieren“, so Roosen zuversichtlich.
Wirtschaft: Osisko Gold Royalties legt Update zu Beteiligungen vor | wallstreet-online.de - Vollständiger Artikel unter:
http://www.wallstreet-online.de/nachricht/9483480-wirtschaft…
nach diesen Nachrichten bleib ich weiter dabei und werde auch noch nachkaufen
die Dinge haben sich nun grundlegend geändert und Barkerville wird wieder in den Blickpunkt der Anleger rutschen. ( besonders natürlich drüben in Canada )
Die Aktie erinnert mich ein wenig an meine OBAN / Osisko Mining Aktie ( die ja auch hier beteiligt sind ) die auch plötzlich auf den Radar der Anleger gekommen & losgerannt sind
Einfaches Einfügen von wallstreetONLINE Charts: So funktionierts.
so mal sehen wo wir uns die nächsten 2 Tage einpendeln damit ich eine Nachkaufmarke finde
unter 1 Dollar wird es wohl kaum mehr gehen
unter 1 Dollar wird es wohl kaum mehr gehen
Antwort auf Beitrag Nr.: 54.750.133 von abbi4 am 18.04.17 09:29:02
Fakt ist, dass die Zonen an der virtuellen Claim Grenze nicht HALT machen ;-)
Im Stockhouse Board unter dem Kürzel BFD kann man dazu mittlerweile einiges finden.
Wer sich die AGM Präsi von Osisko angesehen hat, der sollte sich mal den Verlauf der "Fox" und "Black Dog" discoveries ansehen.
BFD ist in jedem Fall höchst interessant für OSK.
Osisko hat neue
Goldführende Zonen entdeckt, die nach aktueller Faktenlage in die Beaufield Claims hineinragen. Es könnte auch umgekehrt richtig sein...Fakt ist, dass die Zonen an der virtuellen Claim Grenze nicht HALT machen ;-)
Im Stockhouse Board unter dem Kürzel BFD kann man dazu mittlerweile einiges finden.
Wer sich die AGM Präsi von Osisko angesehen hat, der sollte sich mal den Verlauf der "Fox" und "Black Dog" discoveries ansehen.
BFD ist in jedem Fall höchst interessant für OSK.
Antwort auf Beitrag Nr.: 54.753.436 von lale93 am 18.04.17 17:14:10LALE was soll das den, deinen Sch.. kannst wo anders promoten. Wir wollen nur mit ehrlichen Investoren zusammen arbeiten- ich bin SAUER!
Bleib bitte im Thema BGM- wenn Du was positives beitragen kannst , dann bist sehr willkommen.
lg
hbc002
Bleib bitte im Thema BGM- wenn Du was positives beitragen kannst , dann bist sehr willkommen.
lg
hbc002
so Zukauf gerade durchbut unter 1 Dollar gegriffen
hätte eigentlich nicht gedacht das ich so einen Preis bekomme
so nun darf es wieder hoch
hätte eigentlich nicht gedacht das ich so einen Preis bekomme
so nun darf es wieder hoch
soll natürlich gut unter 1 Dollar heissen
Antwort auf Beitrag Nr.: 54.754.402 von hbc002 am 18.04.17 19:22:59
Ärgere mich eigentlich auch immer, wenn vom Thema abgelenkt wird.
BGM heute - gesunder Rücksetzer. Freuen wir uns auf das was da kommt
kannst löschen lassen
kein Problem damit.Ärgere mich eigentlich auch immer, wenn vom Thema abgelenkt wird.
BGM heute - gesunder Rücksetzer. Freuen wir uns auf das was da kommt
Barkerville Announces Closing of Sale of 0.75% NSR Royalty and Acquisition of Additional Mineral Claims in Cariboo Mining District
http://www.barkervillegold.com/investors/news/barkerville-an…
http://www.barkervillegold.com/investors/news/barkerville-an…
Kurs hat sich nun genügend stabilisiert der Dollar hält ....
läuft alles nach Plan und langsam geht es nun wieder hoch Richtung 1,17
läuft alles nach Plan und langsam geht es nun wieder hoch Richtung 1,17
Einfaches Einfügen von wallstreetONLINE Charts: So funktionierts.
Antwort auf Beitrag Nr.: 54.767.731 von senna7 am 20.04.17 16:35:58Sehe ich leider nicht so, ich sehe eher 0,80...
Antwort auf Beitrag Nr.: 54.770.305 von ooy am 20.04.17 21:11:20Bis zu einer seriösen Ressourcenschätzung (idealerweise ergänzt um einen soliden Business Case) hängt der Kurs m.E. stark vom news flow ab. Bleiben gute Nachrichten aus, geht es nochmals südwärts. Kommen weitere starke Bohrergebnisse, kann es weiter aufwärts gehen. Auf jeden Fall bleibt es spannend.
NB: Für einen Kurs nachhaltig > 1 $ braucht es m.E. mind. 3 Mio oz Gesamtressource und eine Jahresproduktion >= 100 tsd oz.
NB: Für einen Kurs nachhaltig > 1 $ braucht es m.E. mind. 3 Mio oz Gesamtressource und eine Jahresproduktion >= 100 tsd oz.
Mit einer Korrektur musste man rechnen. Der Goldpreis hat auch nach unten korrigiert. Ich hoffe mal es ist hier im Forum die Ruhe vor dem nächsten Sturm :-) Barkerville wird sicherlich schon bald die nächsten Bohrdaten und News präsentieren. Oder seid ihr schon alle von Bord gesprungen? Ich bin jedenfalls noch mit dabei.
Auf weiter steigende Kurse!
Auf weiter steigende Kurse!
Antwort auf Beitrag Nr.: 54.807.178 von kubisander22 am 26.04.17 10:04:33Aussage deckt sich mit Bußler-Meinung von gestern (gegen Ende des Filmchens).
Allet wird jutt....
Allet wird jutt....
Antwort auf Beitrag Nr.: 54.807.370 von iwanowski am 26.04.17 10:17:16Hast du evtl. eine Link zu diesem Video? Würde andere hier sicher auch interessieren.
Vielen Dank!
Vielen Dank!
Antwort auf Beitrag Nr.: 54.807.616 von kubisander22 am 26.04.17 10:33:48http://www.deraktionaer.tv/video/busslers-gold-geheimtipps-j…
Kaum habe ich es erwähnt, schon folgen die nächsten Bohrergebnisse.
BGM Intersects 13.63 g/t Au Over 14.55 Metres at Shaft Zone
http://www.barkervillegold.com/investors/news/bgm-intersects…
BGM Intersects 13.63 g/t Au Over 14.55 Metres at Shaft Zone
http://www.barkervillegold.com/investors/news/bgm-intersects…
Barkerville Announces $15 Million Bought Deal and Concurrent $15.8 Million Private Placement Financing
Barkerville Gold Mines Ltd. (TSX VENTURE:BGM) ("Barkerville" or the "Company") is pleased to announce that it has entered into an agreement with Haywood Securities Inc., as lead underwriter on behalf of a syndicate of underwriters (collectively, the "Underwriters"), under which the Underwriters have agreed to purchase, on a "bought deal" private placement basis, 15,790,000 units of the Company ("Units") at a price of $0.95 per Unit (the "Issue Price") for total gross proceeds of $15,000,500 (the "Offering"). Each Unit will consist of one common share (a "Common Share") in the capital of the Company and one half of one common share purchase warrant (each whole common share purchase warrant, a "Warrant") of the Company. Each Warrant shall be exercisable to acquire one Common Share (a "Warrant Share") at a price per Warrant Share of $1.30 for a period of 18 months from the closing of the Offering. The Underwriters have been granted the option (the "Over-Allotment Option") to purchase up to an additional 15% of the number of Units issuable under the Offering, exercisable in whole or in part at any time up to 48 hours prior to the closing of Offering.
In addition, the Company intends to complete a concurrent non-brokered private placement of 16,657,962 Units on the same terms and conditions as the Offering to Osisko Gold Royalties Ltd. ("Osisko Gold Royalties") and Osisko Mining Inc. ("Osisko Mining") for gross proceeds of $15,825,064 (the "Concurrent Private Placement"), such that Osisko Gold Royalties and Osisko Mining maintain their pro rata interest in the Company on a pro forma basis. The Concurrent Private Placement may be increased by up to an additional 15% such that Osisko Gold Royalties and Osisko Mining maintain their respective pro rata interests in the Company.
The net proceeds received by the Company from the Offering and the Concurrent Private Placement will be used for exploration and development of the Company's properties in British Columbia and for working capital and general corporate purposes.
The closing of the Offering is expected to occur on or about May 16, 2017, and is subject to the receipt of regulatory approvals, including the approval of the TSX Venture Exchange. In consideration for their services, the Underwriters will receive a cash commission equal to 6.0% of the gross proceeds of the Offering.
The securities offered have not been, and will not be, registered under the U.S. Securities Act or any U.S. state securities laws, and may not be offered or sold in the United States or to, or for the account or benefit of, United States persons absent registration or any applicable exemption from the registration requirements of the U.S. Securities Act and applicable U.S. state securities laws. This press release does not constitute an offer to sell or the solicitation of an offer to buy securities in the United States, nor in any other jurisdiction.
As insiders of the Company intend to subscribe for Units pursuant to the Concurrent Private Placement, the issuance of those Units to the insiders (the "Insider Participation") will be considered to be a related party transaction within the meaning of TSX Venture Exchange Policy 5.9 and Multilateral Instrument 61-101 ("MI 61-101"). The Company intends to rely on the exemptions from the requirements of MI 61-101 in respect of any Insider Participation.
http://www.minenportal.de/artikel.php?sid=199155&lang=en#Bar…
Antwort auf Beitrag Nr.: 54.821.776 von rolleg am 27.04.17 18:12:05Aus dem Investor Magazin:
Unser Top-Performer der vergangenen Wochen, Barkerville Gold Mines, nutzte die Gunst der Stunde für eine Finanzierung. Am Donnerstag vergangene Woche meldete man zuerst eine Finanzierung in Höhe von 15 Mio. CAD, dies geschah im Rahmen eines „Bought Deal“. Underwriter ist der kanadische Broker Haywood. Bei dem „Bought Deal“ steht der Underwriter für die Platzierung der gesamten Summe gerade. Die Mittel fließen der Gesellschaft also garantiert zu. Das Interesse an der Aktie scheint aber gewaltig zu sein. Rund vier Stunden später erhöhten Barkerville und Haywood das Volumen auf über 23,5 Mio. CAD. Im Zuge der Kapitalmaßnahme werden 24,74 Mio. neue Aktien zu einem Preis von 0,95 CAD ausgegeben. Bei Finanzierungen in Kanada ist es zudem üblich, dass man je Aktie noch eine Aktienkaufoption, einen Warrant, erhält. Im Fall von Barkerville wird jedes Stück mit einem halben Warrant ausgegeben. Jeder ganze Warrant erlaubt Investoren eine weitere Aktie zu einem Kurs von 1,30 CAD zu erwerben. Die Aktienkaufoptionen haben eine Gültigkeit von 18 Monaten.
Die Bought Deal-Finanzierung kommt mit einer „Greenshoe“-Option für Haywood. So kann die Finanzierung um maximal 15% überzeichnet werden. Die Großaktionäre Osisko Gold Royalties
und Osisko Mining wer den im Zuge der Finanzierung neue Aktien im Gesamtwert von 15,83 Mio. CAD zeichnen. Der Anteil der beiden Gesellschaften an Barkerville geht auf Grund des Bought Deals auf knapp über 50% zurück. Das Barkerville-Papier hat derzeit Momentum. Weitere gute Nachrichten und der Beginn der Produktion von Bonanza Ledge könnten der Aktie weiter Auftrieb verleihen. Dennoch raten wir erstmal nur zum „Halten“ des Titels.
(kh)
Hört sich meiner Meinung nach sehr positiv an. Die Interesse am Unternehmen scheint gross zu sein!
Quelle: http://investor-magazin.de/download/investor-magazin_2017/In…
Nächste Bohrresultate
Und weiter gehts mit den Bohrnews BGM Intersects 10.85 g/t Au over 10.75 Metres at Valley Zone
http://www.barkervillegold.com/investors/news/bgm-intersects…
Nächste News
Barkerville Gold Mines Grants Stock Options
http://www.barkervillegold.com/investors/news/barkerville-go…
Ich frage mich gerade ob ich das richtig verstanden habe. Die Optionen für den Kauf der Aktien stehen nur Mitarbeiter von BGM zu. Diese können innerhalb der nächsten 5 Jahre zum Preis von $0.99125 pro Aktie ausgeübt werden. Stimm das so?
Zudem, ist das normal über einen so langen Zeitraum? Meiner Meinung nach eine lukrative Sache für die Mitarbeiter. Sollte auch dazu anspornen, gute Leistungen zu bringen und dadurch den Aktienkurs weiter in die Höhe zu treiben.
Antwort auf Beitrag Nr.: 54.863.905 von kubisander22 am 04.05.17 13:14:29
Sofern weiterhin News mit "brauchbaren Bohrergebnissen" kommen, würde ich mal vermuten, sollte der Kurs einigermaßen stabil bleiben. Was heißt das schon bei einen Explorer...
ich vermute mal
dass wir in den nächsten Wochen etwas Durchhaltevermögen zeigen müssen. Sofern weiterhin News mit "brauchbaren Bohrergebnissen" kommen, würde ich mal vermuten, sollte der Kurs einigermaßen stabil bleiben. Was heißt das schon bei einen Explorer...
Barkerville Gold Mines: Finanzierung auf hohem Niveau
http://investor-magazin.de/0526barkerville-gold-mines-finanz…
http://investor-magazin.de/0526barkerville-gold-mines-finanz…
Antwort auf Beitrag Nr.: 54.871.828 von senna7 am 05.05.17 09:55:32Also gehen die Investoren davon aus, dass der Kurs die 1,30 "überfliegen" wird?
so ist es !!!
und auch ich bin weiter Positiv , zur Zeit hält sich Barkerville bei den "schlechten " Goldmarkt EXTREM stabil....
wir wollen doch ALLE unsere Ziele erreichen
und auch ich bin weiter Positiv , zur Zeit hält sich Barkerville bei den "schlechten " Goldmarkt EXTREM stabil....
wir wollen doch ALLE unsere Ziele erreichen

Antwort auf Beitrag Nr.: 54.872.005 von senna7 am 05.05.17 10:14:54Ja da hast du recht. Wenn man sich mal andere Goldaktien so ansieht haben diese in den letzten Tagen zum Teil stark nachgegeben. Barkerville hat sich im Gegensatz dazu gut gehalten. Natürlich gab es einige Minusprozente aber damit muss man halt rechnen bei so einer Aktie.
https://www.biv.com/article/2017/5/controversial-barkerville…
Controversial Barkerville back in action
Recent discovery boosts stock price of once-troubled Cariboo project
By Tyler Nyquvest | May 2, 2017, midnight
One-time Barkerville Gold Mines boss Frank Callaghan’s claim that the company had found extensive gold deposits ran afoul of B.C. securities regulations, but more recent discoveries under new ownership have bumped up the company’s stock price | BIV files
The ongoing saga of Barkerville Gold Mines (TSX-V:BGM) continues to churn out interesting plot twists, with a recent discovery at the Cariboo gold project triggering an impressive jump in the company’s stock price.
Shares in Barkerville rose over 16% after exploratory drilling unveiled a network of high-grade veining in the Island Mountain area of the company’s tenures, which cover 1,164 square kilometres along a 60-kilometre-long deposit that includes several former hardrock mine sites in the historic Barkerville gold mining camp near the town of Wells, B.C.
“These intersections are some of the best to date on Island Mountain, [which] continues to produce new zones of higher grade, wide zones of gold mineralization,” Chris Lodder, president and CEO of Barkerville Gold Mines, said in a press release.
There has been lengthy debate around whether company founder Frank Callaghan had been justified in making the expansive claims about the property that led to his downfall.
Callaghan first made headlines when the then-CEO advised that one of his properties, Cow Mountain, had indicated resources of 10.6 million ounces of gold at grades of 5.26 grams per tonne.
The BC Securities Commission (BCSC) immediately challenged these claims and halted the company’s shares for over a year while it commissioned a new resources estimate. The new report compelled the company to retract its earlier claims, causing Barkerville’s shares to dive from $1.22 per share to $0.21 per share.
Callaghan, who did not respond to Business in Vancouver’s request for comment, resigned as CEO of Barkerville in 2014, and as a director of the company in 2015. He later agreed to pay a $30,000 fine and serve a one-year ban from capital markets after the BCSC accused him of violating disclosure rules.
The question now remains: was Callaghan right after all?
In a sense, maybe, says Mickey Fulp, publisher of the Mercenary Geologist newsletter.
“These new drill holes they have are in the Island Mountain area and those were never explored during Callaghan’s tenure,” Fulp said. “It is a past-producing gold mine, but this is essentially a new discovery based on the very good geological understanding of the current gold mineralization.”
Mineral exploration company Osisko Mining Corp. (TSX: OSK) took a 17% stake in Barkerville in 2016 and can be credited with reignited interest in the area. Osisko Gold Royalties (TSX: OR), a separate but related company, now owns roughly 55% of Barkerville Gold Mines.
“[Osisko] controls 60 to 70 kilometres of potential ground in the Cariboo mining district,” Fulp said. “They put in a very good geological team, and once that happened it kind of piqued my interest.”
Barkerville stock is up 148% in 2017, with most of the gains coming in the last month.
John Burzynski, president and CEO of Osisko Mining, declined to comment on the history of the Callaghan mine but noted that Osisko has been successful in revamping mines that had gone stale.
He said there is ample precedent in Canada when it comes to young companies investing in initially fruitless mining deposits that are later successfully exploited by another company.
Fulp noted that the recent Barkerville discoveries are largely unconnected to earlier claims.
“This is a prospective area for gold mineralization, and this new area that Osisko is drilling now is all new discoveries; it has nothing to do with anything Callaghan ever did.”
“One thing I will say about Callaghan is that he assembled the land positions,” Fulp added. “You have to give him credit for that.”
jetzt sind es halt nicht 90 Mio sondern 100 MIO
mir doch egal , warum man Callaghan damals nicht geglaubt hat und was für Fehler er gemacht hat ....
jetzt ist mir erstmal unheimlich wohl dabei das Osisko ( Royal & mining ) hier kräftig mitmischen , mit dennen hab ich bisher sehr gute Erfahungen gemacht
das wird noch eine Story hier ....
mir doch egal , warum man Callaghan damals nicht geglaubt hat und was für Fehler er gemacht hat ....
jetzt ist mir erstmal unheimlich wohl dabei das Osisko ( Royal & mining ) hier kräftig mitmischen , mit dennen hab ich bisher sehr gute Erfahungen gemacht
das wird noch eine Story hier ....
sehe ich ähnlich .....Peter George, der Geologe hat damals zwar dick auf´s Mett gehauen, aber ein bischen Wahrheit ist meist immer mit im Spiel.
Wird noch eine Bombenstory...ich bleibe auch definitiv dabei....
Wird noch eine Bombenstory...ich bleibe auch definitiv dabei....
... und es geht weiter:
BGM Intersects 13.31 g/t Au over 11.00 Metres at Shaft Zone
May 9th, 2017
http://www.barkervillegold.com/investors/news/bgm-intersects…
Freundliche Grüße
supernova
BGM Intersects 13.31 g/t Au over 11.00 Metres at Shaft Zone
May 9th, 2017
http://www.barkervillegold.com/investors/news/bgm-intersects…
Freundliche Grüße
supernova
Nächste Bohrresultate
Und weiter gehts mit den Bohrnews:BGM Intersects 13.31 g/t Au over 11.00 Metres at Shaft Zone
http://www.barkervillegold.com/investors/news/bgm-intersects…
sauberer Anstieg gestern
die Konsolidierung scheint vorbei. Here we go. 

Antwort auf Beitrag Nr.: 54.936.428 von senna7 am 13.05.17 10:53:09
Fehlt nur noch, dass die Bohrungen hier auch Ergebnisse in kg. pro Tonne bringen wie bei Osisko, dann steppt der Bär wieder.
Die Bestätigung der bisherigen Grade bei weiteren Bohrungen würde auch reichen.
Dir ist ja eh
bewusst, dass ich da nicht so weit weg binFehlt nur noch, dass die Bohrungen hier auch Ergebnisse in kg. pro Tonne bringen wie bei Osisko, dann steppt der Bär wieder.
Die Bestätigung der bisherigen Grade bei weiteren Bohrungen würde auch reichen.
Jetzt geht das Zäpfchen richtig ab....
BGM $ 1.26 real time data Change Up
Change:
0.17 (15.60%) Volume: 2,522,375
BGM $ 1.26 real time data Change Up
Change:
0.17 (15.60%) Volume: 2,522,375
na nachdem das alte Hoch überwunden wurde gab es wohl KAUFPANIK
ich hab es Euch gesagt
nun haben wir wieder einen unteren Wiederstand / Haltelinie bei 1,19 TOP
ich hab es Euch gesagt
nun haben wir wieder einen unteren Wiederstand / Haltelinie bei 1,19 TOP
Antwort auf Beitrag Nr.: 54.958.601 von senna7 am 16.05.17 22:41:02Schöner Anstieg für alle die schon dabei waren, weniger schön für solche die noch einsteigen wollten :-) Zum Glück war ich schon dabei.
Hatte evtl. diese News einen Einfluss?
Barkerville Announces Mailing Of Management Information Circular
http://www.barkervillegold.com/investors/news/barkerville-an…
Die Leute im Bericht bringen einen schönen Rucksack an Erfahrung mit...
Hatte evtl. diese News einen Einfluss?
Barkerville Announces Mailing Of Management Information Circular
http://www.barkervillegold.com/investors/news/barkerville-an…
Die Leute im Bericht bringen einen schönen Rucksack an Erfahrung mit...
kann sein , ich persönlich denke wirklich viele haben noch auf günstigere Kurse gewartet , sind nicht gekommen und nun rennen sie hionterher und kaufen kräftig ....
für mich ist der Weg nach oben nun auch frei .....
für mich ist der Weg nach oben nun auch frei .....
Auf alle Fälle ist nun Schwung in der Aktie .... achtet aber auf die Unterstützung(en)
Antwort auf Beitrag Nr.: 54.964.595 von senna7 am 17.05.17 16:54:00http://www.goldseiten.de/artikel/332295--BGM-announces-filin…
Antwort auf Beitrag Nr.: 54.958.601 von senna7 am 16.05.17 22:41:02
die 1,19 haben gehalten .... super und Glückwunsch die da gekauft kaufen
Zitat von senna7: na nachdem das alte Hoch überwunden wurde gab es wohl KAUFPANIK
ich hab es Euch gesagt
nun haben wir wieder einen unteren Wiederstand / Haltelinie bei 1,19 TOP
die 1,19 haben gehalten .... super und Glückwunsch die da gekauft kaufen
Zwei News
Heute gleich zwei gute News:BGM intersects 39.05 g/t Au over 8.25 metres at Shaft Zone
http://de.advfn.com/p.php?pid=nmona&article=74638705
Barkerville Gold Mines Completes $44 Million Financing
https://www.juniorminingnetwork.com/junior-miner-news/press-…
Interessant dabei auch die Insider, die weiter kräftig kaufen:
Insider Insider Relationship Units
Purchased (#) Subscription
Amount ($)
Osisko Gold Royalties Ltd 10% Securityholder 11,333,054 $10,766,401.30
Osisko Mining Inc. 10% Securityholder 5,324,908 $5,058,662.60
Sean Roosen Director of Barkerville;
Director or Senior Officer of 10% Securityholder 500,000 $475,000.00
Bryan Coates Senior Officer of 10% Securityholder 52,632 $50,000.40
Jose Vizquerra Director and Senior Officer of 10% Securityholder 73,685 $70,000.75
Andres Tinajero(1) Senior Officer of Barkerville 100,000 $95,000.00
Morris Prychidny Director of Barkerville 200,000 $190,000
Jacques Perron Director of 10% Securityholder 15,789 $14,999.55
Gernot Wober Senior Officer of 10% Securityholder 35,000 $33,250.00
John Kutkevicius Director of Barkerville 100,000 $95,000.00
Totals 17,635,068 $16,753,314.60
die erste Nachricht gefällt mir besser als die 2. ....
nun gut in solchen Phasen sind PP fast überall daran hab ich mich mittlerweile gewöhnt.
Man will das Geld ja dafür wieder für weitere Explorationen und wohl für den Aufbau einer Mühle nehmen ...auch gut ...
nun gut in solchen Phasen sind PP fast überall daran hab ich mich mittlerweile gewöhnt.
Man will das Geld ja dafür wieder für weitere Explorationen und wohl für den Aufbau einer Mühle nehmen ...auch gut ...
Leider hat die 1,19 er Marke deshalb auch nicht gehalten ...aber egal im Bereich um die 0,95 kauf ich nochmal zu
mal sehn ob ich nochwas bekomme
mal sehn ob ich nochwas bekomme
Antwort auf Beitrag Nr.: 54.972.830 von senna7 am 18.05.17 17:16:49
0,95 stinky bid - was soll man sagen, wenn das "gefilled" wird solls mir recht sein. Denke eher an 2 CAD als an 0,95.
Sieht man öfters, dass richtig gute Nachrichten erst ein bis zwei Tage später einschlagen.
1,19 hat nicht gehalten
... Unschärfe im Chartbild0,95 stinky bid - was soll man sagen, wenn das "gefilled" wird solls mir recht sein. Denke eher an 2 CAD als an 0,95.
Sieht man öfters, dass richtig gute Nachrichten erst ein bis zwei Tage später einschlagen.
hab kein Problem mit 2 Dollar , sehe die Aktie auf 2-3 Jahre sogar noch viel höher
Nur sollten wir noch ein wenig rumzicken nter den Dollar , kauf ich mir noch ein paar Stücke ....
Nur sollten wir noch ein wenig rumzicken nter den Dollar , kauf ich mir noch ein paar Stücke ....
Antwort auf Beitrag Nr.: 54.977.519 von senna7 am 19.05.17 10:36:19
Read more at http://www.stockhouse.com/news/press-releases/2017/05/25/bgm…
...
Die Party geht weiter
ich mach mir gleich noch ein Vatertagsseidl auf
BGM Intersects 24.13 g/t Au Over 12.70 Metres at Mosquito CreekRead more at http://www.stockhouse.com/news/press-releases/2017/05/25/bgm…
...
Die Party geht weiter
des hasd Seidla ....
wie wir Frankn sogn .... 1,90 kosded des bei uns
wie wir Frankn sogn .... 1,90 kosded des bei uns
Antwort auf Beitrag Nr.: 55.018.806 von senna7 am 25.05.17 22:09:23
meine Nachbarn würden sich selbst als
"Franggn" betiteln, kurz daneben dann die "Randfranggn", dann komm ich ... auch nicht besser aber anders
Falls es jemanden interessiert :
May 30/17 May 30/17 Oban Mining Corporation Direct Ownership Common Shares 10 - Acquisition in the public market 2,022,000 $1.10
May 30/17 May 30/17 Oban Mining Corporation Direct Ownership Common Shares 10 - Acquisition in the public market 2,022,000 $1.10
http://www.finanztreff.de/news/beide-osisko-gesellschaften-h…
Beide Osisko-Gesellschaften halten mittlerweile mehr als 50 % an Barkerville
...
Bei den Osisko-Führungsteams um Sean Roosen und John Burzynski handelt es sich um regelrechte Company-Maker die auch schon mehrere Minen aufgebaut haben. Deshalb ist die Wahrscheinlichkeit hoch, dass Barkervilles 'Cariboo'-Prjekt in Produktion gebracht werden soll.
Die Analysten von Haywood Securities sehen aufgrund des noch andauernden Bohrprogramms und der bisherigen Bohrerfolge für die Aktie noch Luft nach oben und hielten auch in ihrem neuesten Unternehmensupdate an ihrer spekulativen Kaufempfehlung fest. Das Kursziel wird auf vorerst 1,60 CAD festgesetzt, was noch einem Restpotenzial von fast 40 % entspricht.
...
Freundliche Grüße
supernova
BGM Intersects 12.43 g/t Au Over 7.20 Metres at Valley Zone
http://www.barkervillegold.com/investors/news/bgm-intersects…
http://www.barkervillegold.com/investors/news/bgm-intersects…
Die News scheinen gut angekommen zu sein. Der Goldpreis spielt ebenfalls mit. Auf zu neuen Höhen? Ich glaube schon :-)
noch jemand da?
Leider macht die Aktie in den letzen Tagen nicht so grosse Freude. Ich frage mich, ist hier überhaupt noch jemand dabei da es plötzlich so ruhig geworden ist hier im Forum :-)Hoffe es kommen bald weitere Bohrergebnisse und die Meldung bezüglich des Produktionsstarts. Dies könnte wieder ein Bisschen Auftrieb geben. Was denkt ihr?
Antwort auf Beitrag Nr.: 55.169.582 von kubisander22 am 20.06.17 10:52:58
Finde eigentlich, dass sich die Aktie nun über mehrere Wochen, trotz ausbleibender News recht gut auf hohem Niveau gehalten hat. Erst Recht wenn man das Marktumfeld betrachtet.
Um hier starke Impulse in das Papier zu bekommen, brauch es m. E. nach News hinsichtlich Produktionsstart. Mit Bohrergebnissen erzielt man hier glaube ich kein Feuerwerk mehr. Der Boden ist spitze, das ist klar.
Zitat von kubisander22: Leider macht die Aktie in den letzen Tagen nicht so grosse Freude. Ich frage mich, ist hier überhaupt noch jemand dabei da es plötzlich so ruhig geworden ist hier im Forum :-)
Hoffe es kommen bald weitere Bohrergebnisse und die Meldung bezüglich des Produktionsstarts. Dies könnte wieder ein Bisschen Auftrieb geben. Was denkt ihr?
Finde eigentlich, dass sich die Aktie nun über mehrere Wochen, trotz ausbleibender News recht gut auf hohem Niveau gehalten hat. Erst Recht wenn man das Marktumfeld betrachtet.
Um hier starke Impulse in das Papier zu bekommen, brauch es m. E. nach News hinsichtlich Produktionsstart. Mit Bohrergebnissen erzielt man hier glaube ich kein Feuerwerk mehr. Der Boden ist spitze, das ist klar.
Antwort auf Beitrag Nr.: 55.169.582 von kubisander22 am 20.06.17 10:52:58
Immer im Hinterkopf behalten: Prinzipiell schippen die n Haufen Dreck hin und her und zwischendurch fällt bisl Gold dabei ab.
Man kann natürlich Glück haben und erwischt eine Aktie vor einem großen UpMove und macht dann 100% oder mehr an einem Tag, in einer Woche oder einem Monat. Die Regel ist das aber sicher nicht.
Es heißt hier schon Geduld haben.
Ich erwarte hier nicht sehr viel in den kommenden 2 Monaten - lasse mich auch gern vom Gegenteil überraschen. Seien wir mal froh (wie mein Vorredner schon sagte), dass wir auf hohem Niveau gut konsolidieren.
Zitat von kubisander22: [...]Ich frage mich, ist hier überhaupt noch jemand dabei da es plötzlich so ruhig geworden ist hier im Forum :-)[...]Du bist noch nicht wirklich lange an Bord oder? Ich habe diese Aktie vmtl. seit 4 oder 5 Jahren im Depot (immer wieder zugekauft). Das ist vollkommen normal, dass da nicht jeden Tag was Neues raus kommt.
Immer im Hinterkopf behalten: Prinzipiell schippen die n Haufen Dreck hin und her und zwischendurch fällt bisl Gold dabei ab.
Man kann natürlich Glück haben und erwischt eine Aktie vor einem großen UpMove und macht dann 100% oder mehr an einem Tag, in einer Woche oder einem Monat. Die Regel ist das aber sicher nicht.
Es heißt hier schon Geduld haben.
Ich erwarte hier nicht sehr viel in den kommenden 2 Monaten - lasse mich auch gern vom Gegenteil überraschen. Seien wir mal froh (wie mein Vorredner schon sagte), dass wir auf hohem Niveau gut konsolidieren.
BGM Intersects 17.55 g/t Au over 6.20 Metres at Valley Zone
Neue BohrnewsBGM Intersects 17.55 g/t Au over 6.20 Metres at Valley Zone
http://www.barkervillegold.com/investors/news/bgm-intersects…
Weiter Insiderkäufe
Insider Buying: Barkerville Gold Mines Ltd (BGM) Director Buys C$19,400.00 in StockBarkerville Gold Mines Ltd (CVE:BGM) Director Donald Robert Njegovan acquired 20,000 shares of the stock in a transaction on Wednesday, June 21st. The stock was bought at an average cost of C$0.97 per share, for a total transaction of C$19,400.00.
Die Direktoren/Insider füllen sich weiterhin ihre Taschen mit Barkerville Aktien, die sie zu Marktpreisen kaufen.
Eindeutig gutes Zeichen, dass sie übezeugt sind, dass Barkerville unterbewertet ist. Ich denke, der Produktionsstart der Mühle sollte auch anstehen. Er war m.E. für Mitte 2017 anvisiert.
Bewertung ... Bonanza Produktionsstart und so weiter.. ..
Hi,super Info bzgl. Insiderkäufe, das Unternehmen verfolge ich auch schon seit längerem. Spricht eigentlich einiges für das Unternehmen, wobei die Bewertung in diesem Jahr auch schon sehr stark angestiegen ist!
435,363,733 Fully diluted Shares und bei 0,90 CAD sind das ~392 Mio CAD. abzgl. 48 Mio. CAD CASH ergibt das dann 344 Mio CAD.
Demgegenüber stehen geschätzte 4,5 Mio. Unzen (?? stimmt das) + weiteres Potential
macht eine Bewertung von 76,44 CAD pro Unze.
Sehr positiv aus meiner Sicht:
Shareholder, Management, Bohrergebnisse, Projekt, Insiderkäufe (erfolgen alle auf höherem Level).
Shortterm Produktionsstart von Bonanza ist aktuell geplant für Q3/2017.
Da gehts aber soweit ich das überblicke nur um ein Sideproject.
Ich finde das Unternehmen spannend und bin jetzt auch dabei.
liebe Grüße
~~~
Barkerville Announces Stock Option and RSU Grants
http://www.barkervillegold.com/investors/news/barkerville-an… Produktionsstart August 2017
"...Underground mine development continues at Bonanza Ledge with processing at the QR mill to start in August."News von heute:
BGM Intersects 17.30 G/T Au Over 7.50 Metres at Valley Zone
Expansion of Vein Corridors Continues
TORONTO, July 5, 2017 /CNW/ - Barkerville Gold Mines Ltd. (TSXV: BGM) (the "Company" or "Barkerville") is pleased to announce additional drilling results from the ongoing 130,000 metre Phase II Island Mountain exploration drilling program at the Company's flagship Cariboo Gold Project. The Company is currently exploring and delineating the Valley and Shaft Zones with seven drill rigs, while an eighth drill rig is conducting exploratory drilling on Barkerville Mountain. Detailed drilling results, a drill hole location plan map, vertical section and longitudinal section are presented at the end of this release.
Veining Corridors Continue to Develop in Valley Zone
The ongoing exploration and delineation drilling program in the Valley Zone continues to corroborate veining corridors as demonstrated by drillhole CM-17-057 which intersected a broad network of veining averaging 17.30 g/t Au over 7.50 metres at vertical depth of 170 metres below surface. At the same elevation 130 metres along vein strike to the southwest, drillhole CM-17-048 delineated additional veining grading 12.27 g/t Au over 4.55 metres. In a previously unexplored portion of the Valley Zone, another new veining occurrence averaging 11.33 g/t Au over 3.00 metres was discovered by drillhole CM-17-053 at a vertical depth of 140 metres below surface. Because of the wide hole spacings and scarcity of historical drilling in these areas, all occurrences are open for expansion.
"The high-grade vein corridors in the Valley Zone continue to be identified and will require infill drilling later in the year." noted Chris Lodder, President and CEO of Barkerville Gold Mines. "Seven drills are focused on infill drilling on Island Mountain and one rig is conducting reconnaissance drilling on Barkerville Mountain. Regional exploration in the larger land package was reinitiated last week and will continue until late September. The objective of the regional exploration program is to continue the advancement of future drill targets. Underground mine development continues at Bonanza Ledge with processing at the QR mill to start in August."
Antwort auf Beitrag Nr.: 55.267.096 von Goldbarren999 am 05.07.17 14:09:14Hoffe schwer, dass der Abwärtstrend bald beendet wird und wir in eine Seitwärtsbewegung gelangen. Danach die Meldung für die Produktionsaufnahme hoffentlich schon im August und wir sehen hoffentlich wieder höhere Kurse. Wenn man sich jeweils den Tagesverlauf so ansieht wird die Aktie immer gegen Börsenschluss noch ins Minus gedrückt. Woran könnte das liegen? Mir fehlt dazu leider das Wissen und ich kann auch nur speklulieren. Da wollen wohl einige nochmals zu günstigen Konditionen einsteigen...
Antwort auf Beitrag Nr.: 55.278.511 von kubisander22 am 07.07.17 06:42:21
Auf der anderen Seite ist aktuell (im Sommer) auch nicht unbedingt eine gute Zeit für Explorer.
typisch
wenn professionelle Akteure unterwegs sind, die weiter aufkaufen möchten. Voraussagen bei Explorern sind schwer. Wenn der Goldpreis weiter sinkt, haben wir eine schwere Zeit vor unsAuf der anderen Seite ist aktuell (im Sommer) auch nicht unbedingt eine gute Zeit für Explorer.
BGM Intersects 29.95 g/t Au over 8.85 metres at Shaft Zone
July 26th, 2017
http://www.barkervillegold.com/investors/news/bgm-intersects…
Freundliche Grüße
supernova
July 26th, 2017
http://www.barkervillegold.com/investors/news/bgm-intersects…
Freundliche Grüße
supernova
BGM Intersects 18.84 G/T Au Over 30.85 Metres At Shaft Zone
August 9th, 2017
NEW EXPANSION AT DEPTH GRADES 12.76 G/T AU OVER 25.40 METRES
...
http://www.barkervillegold.com/investors/news/bgm-intersects…
Freundliche Grüße
supernova
August 9th, 2017
NEW EXPANSION AT DEPTH GRADES 12.76 G/T AU OVER 25.40 METRES
...
http://www.barkervillegold.com/investors/news/bgm-intersects…
Freundliche Grüße
supernova
Neue Homepage
Barkerville hat übrigens ein neuer Internetauftritt. Reinschauen lohnt sich!http://barkervillegold.com/
Ermutigende Weichenstellungen sind erfolgt. Jetzt muss aber allmählich geliefert werden, sonst fährt der Karren am Ende doch an die Wand. Das heißt, statt 10 Cent Loss per share und Jahr braucht die Company diesen Wert mit positiven Vorzeichen, wenn die Investierten weiter an Bord bleiben sollen. Ob das aber so kommt, scheint mir durchaus noch nicht sicher. Denn die Verwässerung ist bereits weit fortgeschritten.
Antwort auf Beitrag Nr.: 55.523.610 von kubisander22 am 14.08.17 22:00:43
OSISKO STYLE
Zitat von kubisander22: Barkerville hat übrigens ein neuer Internetauftritt. Reinschauen lohnt sich!
http://barkervillegold.com/
OSISKO STYLE
Antwort auf Beitrag Nr.: 55.534.329 von senna7 am 16.08.17 11:28:56Barkerville drills 10.55 m of 14.03 g/t Au at Cariboo
https://www.stockwatch.com/News/Item.aspx?bid=Z-C%3aBGM-2499…
https://www.stockwatch.com/News/Item.aspx?bid=Z-C%3aBGM-2499…
Investor Magazin berichtet über Barkerville
Ein neuer Bericht im Investor Magazin gibts zu Barkerville. Hört sich äusserst interessant an. Hoffen wi dass die Vermutungen eintreten.http://investor-magazin.de/download/investor-magazin_2017/In…
Antwort auf Beitrag Nr.: 55.627.817 von kubisander22 am 30.08.17 12:51:41
Der steigende Goldpreis und die permanent neu explorierten Ressourcen...
Der nächste Schub kann kommen
Interessant erscheint dann
ja schon mal generell die Bewertung. Gibt ja "Produzenten", die ähnliche Größenordnungen des Outputs erreichen.Der steigende Goldpreis und die permanent neu explorierten Ressourcen...
Der nächste Schub kann kommen
Barkerville Gold Mines Ltd. Announces $28,000,000 Bought Deal Flow-Through Equity Financing
TORONTO, Sept. 1, 2017 /CNW/ - Barkerville Gold Mines Ltd. (TSXV:BGM) ("Barkerville" or the "Corporation") is pleased to announce that it has entered into an agreement with Canaccord Genuity Corp., on behalf of a syndicate of underwriters (collectively the "Underwriters"), whereby the Underwriters have agreed to purchase, on a "bought deal" private placement basis, 25,000,000 common shares of the Corporation that will qualify as "flow-through shares" (within the meaning of subsection 66(15) of the Income Tax Act (Canada) ("Flow-Through Shares") at a price of $1.12 per Flow-Through Share (the "Issue Price") for gross proceeds of $28,000,000 (the "Offering"). The Issue Price represents an approximate 24% premium to the closing price of common shares of the Corporation on the TSX Venture Exchange (the "TSXV") on August 31, 2017 and an approximate 29% premium to the volume weighted average price of common shares of the Corporation on the TSXV over the last five trading days.
The Corporation will use the gross proceeds of Offering to fund the exploration and development of Barkerville's Cariboo Gold Project in central British Columbia, which expenditures will qualify as "flow-through mining expenditures" (within the meaning of subsection 66(15) of the Income Tax Act (Canada)) (the "Qualifying Expenditures"). The Qualifying Expenditures will be renounced to the subscribers of Flow-Through Shares with an effective date of no later than December 31, 2017 and in an aggregate amount of not less than the gross proceeds of the Offering.
The Offering is expected to close on or about September 28, 2017 and is subject to certain closing conditions including, but not limited to, the receipt of all necessary approvals including the conditional listing approval of the TSXV and the applicable securities regulatory authorities. The Offering is being made by way of private placement in Canada. The securities will not be offered or sold in the United States. The securities issued under the Offering will be subject to a hold period expiring four months and one day from the closing date of the Offering. The Offering is subject to final acceptance of the TSX Venture Exchange.
...
http://www.minenportal.de/artikel.php?sid=211033&lang=en#Bar…
Antwort auf Beitrag Nr.: 55.646.780 von rolleg am 01.09.17 13:24:43Barkerville Gold Mines Ltd. Announces $7 Million Increase to Previously Announced "Bought Deal" Private Placement
http://www.minenportal.de/artikel.php?sid=211064&lang=en#Bar…
http://www.minenportal.de/artikel.php?sid=211064&lang=en#Bar…
Hallo ist die Bewertung nicht ein bisschen hoch wo doch am Anfang nur 30 000 Unzen produziert werden? ungefähr 30 000 Unzen....
Die Market cap liegt bei Marktkap.
309,23 Mio. Dollar und da wurde ja noch nichts produziert finde ich ein bisschen sportlich oder sind 300 Millionen Market cap bei einer Mine mit 30 000-50 000 Unzen normal?
Investor Magazin: Derzeit sieht der Minenplan eine Produktion von 30.000 Unzen Gold pro Jahr vor. Die QR-Mill hat eine Genehmigung für die Verarbeitung von bis zu 150.000 Tonnen pro Jahr. Intern plant man Gerüchten zu Folge bereits, diese Genehmigung erweitern zu lassen und so die Produktion auf mögliche 50.000 Unzen pro Jahr zu erhöhen.
Antwort auf Beitrag Nr.: 55.651.751 von freddy1989 am 02.09.17 00:31:08
Geh mal davon aus, dass die gegenwärtige Anlage nicht viel mehr als 150.000 Tonnen Gestein verarbeiten kann. Was würde dann den Schub von 30.000 auf 50.000 Unzen auslösen?
Die Antwort auf diese Frage könnte den Wert der Aktie schon deutlich steigern
Aus dieser Information
könnten einige interessante Informationen enthalten sein.Geh mal davon aus, dass die gegenwärtige Anlage nicht viel mehr als 150.000 Tonnen Gestein verarbeiten kann. Was würde dann den Schub von 30.000 auf 50.000 Unzen auslösen?
Die Antwort auf diese Frage könnte den Wert der Aktie schon deutlich steigern
lach
Ja es kommt halt auf den Erzgehalt an den die Firma verarbeiten kann. Aber ich denke das die Firma die Anlage erweitern wird 150 000 Tonnen ist doch recht klein die meisten "kleineren" Firmen haben so 250 000 Tonnen Anlagen und bei Firmen die nur "Erzgehalte" von 1 Gramm oder weniger haben kommen oft 1 Millionen Tonnen zum Einsatz.
Wie findet ihr die Market cap?ich habe keinen richtigen Vergleich aber ohne Produktion so eine hohe Market cap bei vllt 50 000 Unzen?
Es geht hier bei der Bewertung nicht um die läppischen Anfangsproduktion da denkst Du völlig falsch , blättere mal ein paar Jahre zurück und dann wirst Du verstehen warum das was ganz GROSSES werden kann ...
ich sag nur : 65 -90 MIO Unzen
https://www.biv.com/article/2015/7/new-chapter-controversial…
dazu ist man eine Partnerschaft mit Osisko eingegangen und Eric Sprott ist auch dabei
darum geht es hier ..... !!!
ich sag nur : 65 -90 MIO Unzen

https://www.biv.com/article/2015/7/new-chapter-controversial…
dazu ist man eine Partnerschaft mit Osisko eingegangen und Eric Sprott ist auch dabei
darum geht es hier ..... !!!
Antwort auf Beitrag Nr.: 55.653.083 von senna7 am 02.09.17 11:57:15und wieder 100 K Insiderkauf
Sep 1/17 Aug 30/17 Prychidny, Morris Direct Ownership Common Shares 10 - Acquisition in the public market 100,000 $0.870
Sep 1/17 Aug 30/17 Prychidny, Morris Direct Ownership Common Shares 10 - Acquisition in the public market 100,000 $0.870
Bevor sich einige die Köppe wirr & heiß reden, sollten wir uns mal wieder das Tippspiel, bzw. die Tippspielauswertung nach "Callaghans&Georges Superfund" 2012 ins Gedächtnis rufen.
Einige glaubten, so meine ich mich zu erinnern, dass weit über 10 Cad-Dollar drin sind.
Und seitdem hat sich eigentlich substanziell nichts nach unten hin verändert... ganz im Gegenteil (siehe Bohrergebnisse der letzten 2 Jahre, Osisko- u.Sprottengagement, etc..)!!
Einige glaubten, so meine ich mich zu erinnern, dass weit über 10 Cad-Dollar drin sind.
Und seitdem hat sich eigentlich substanziell nichts nach unten hin verändert... ganz im Gegenteil (siehe Bohrergebnisse der letzten 2 Jahre, Osisko- u.Sprottengagement, etc..)!!
Antwort auf Beitrag Nr.: 55.653.083 von senna7 am 02.09.17 11:57:15
Na, der Report macht ja ordentlich Lust auf ein Investment....
Zitat von senna7: Es geht hier bei der Bewertung nicht um die läppischen Anfangsproduktion da denkst Du völlig falsch , blättere mal ein paar Jahre zurück und dann wirst Du verstehen warum das was ganz GROSSES werden kann ...
ich sag nur : 65 -90 MIO Unzen
https://www.biv.com/article/2015/7/new-chapter-controversial…
dazu ist man eine Partnerschaft mit Osisko eingegangen und Eric Sprott ist auch dabei
darum geht es hier ..... !!!
Na, der Report macht ja ordentlich Lust auf ein Investment....
Antwort auf Beitrag Nr.: 55.654.214 von Bulle2911 am 02.09.17 16:59:33Klar , es ist einiges schief gelaufen in der Vergangenheit , aber die Zeiten sind ja Gott sei Dank vorbei. Mittlerweile hat sich einiges zum Guten verbessert ( z.B die Ablösung vom CEO ) und eben die Zusammenarbeit mit Osisko.
Keiner muß hier investieren der nicht will @Bulle aber nachher ja nicht rumheulen und wundern wenn noch große Reserven offiziell erbohrt werden - woran ich auch fest glaube.
Wenn nicht 90 MIO mir reichen auch 50 Mio Unzen
PS . Das Tipspiel von damals
Keiner muß hier investieren der nicht will @Bulle
aber nachher ja nicht rumheulen und wundern wenn noch große Reserven offiziell erbohrt werden - woran ich auch fest glaube.Wenn nicht 90 MIO mir reichen auch 50 Mio Unzen
PS . Das Tipspiel von damals
Antwort auf Beitrag Nr.: 55.654.406 von senna7 am 02.09.17 18:10:33Senna, ich glaube schon, dass wir die 3,50 sehen werden ok es dauert länger als von mir gedacht. Nur konnten wir diese Meldungen von FC nicht so einschätzen- was er uns so vorgelogen hatte.
Jetzt gibt es ein starkes Team und Kapitalstarke Investoren.
Wen alles gut läuft -siehe meine MTA- dann geht die Post schon mal nach oben ab.
lg
hbc002
Jetzt gibt es ein starkes Team und Kapitalstarke Investoren.
Wen alles gut läuft -siehe meine MTA- dann geht die Post schon mal nach oben ab.
lg
hbc002
http://barkervillegold.com/2017/09/bgm-intersects-18-84-gt-a…
BGM DISCOVERS 53.26 G/T AU OVER 11.55 METRES AT SHAFT ZONE
...
Freundliche Grüße
supernova
BGM DISCOVERS 53.26 G/T AU OVER 11.55 METRES AT SHAFT ZONE
...
Freundliche Grüße
supernova
Das sind doch mal wieder klasse Löcher !!! über 50 Gramm
ich wundere mich echt warum BGM zur Zeit nur seitwärts läuft , denke aber wenn die 0,95 Cad Cent fallen könnte es mal wieder richtig höher gehen.
Ich habe gestern nochmal bei 0,87 ein paar Stücke zugekauft
da ich bald mit einen Ausbruch nach oben aus den Dreieck rechne wenn Gold weider steigt .

ich wundere mich echt warum BGM zur Zeit nur seitwärts läuft , denke aber wenn die 0,95 Cad Cent fallen könnte es mal wieder richtig höher gehen.
Ich habe gestern nochmal bei 0,87 ein paar Stücke zugekauft
da ich bald mit einen Ausbruch nach oben aus den Dreieck rechne
wenn Gold weider steigt .
Antwort auf Beitrag Nr.: 55.680.516 von senna7 am 06.09.17 15:37:13super Chart wieder mal von Dir!
Danke ....
ich hoffe natürlich das der Ausbruch NICHT nach unten von statten geht ... aber ehrlich gesagt ich sehe auch dafür keinen fundamentalen Grund ...IHR ????
ich hoffe natürlich das der Ausbruch NICHT nach unten von statten geht ... aber ehrlich gesagt ich sehe auch dafür keinen fundamentalen Grund ...IHR ????
Antwort auf Beitrag Nr.: 55.696.524 von senna7 am 08.09.17 10:40:48
der erste Absatz der letzten PR
sollte eigentlich Zweifler verstummen lassen
Antwort auf Beitrag Nr.: 55.680.516 von senna7 am 06.09.17 15:37:13Danke Senna, wir leben noch- die Minen haben den GP Anstieg nicht -noch- mit gemacht. Unsere Traumkurse sehen wir noch. Ein Nachkauf auf dem Niveau ist schlüssig.
Zeichne mir bei MTA auch so einen geilen Chart. Gilt nur für Dich.
LG
hbcoo2
Zeichne mir bei MTA auch so einen geilen Chart. Gilt nur für Dich.
LG
hbcoo2
Haywood hat sie auch auf dem "Radar" (Seite 11):
http://cdn.ceo.ca.s3-us-west-2.amazonaws.com/1cqqlfe-MMSept1…
http://cdn.ceo.ca.s3-us-west-2.amazonaws.com/1cqqlfe-MMSept1…
Antwort auf Beitrag Nr.: 55.696.524 von senna7 am 08.09.17 10:40:48Hi Senna, das BM zu MTA kam nicht an.
lg
hbc002
lg
hbc002
Neue Präsentation
Man sollte sich mal die neue Präsentation zu Auge führen. Steht einiges drin.http://barkervillegold.com/wp-content/uploads/2017/09/BGM_SE…
Vor allem das gefällt mir sehr:
Bonanza Ledge - Milling Began in last week of August 2017 (Seite 16)
Hier ist wohl bald mit News zu rechnen bezüglich angelaufener Produktion.
Neueinschätzung der Barkerville Gold Mines-Aktie!
13.09.17 16:20Industrial Alliance Sec.
Quebec (www.aktiencheck.de) - Barkerville Gold Mines-Aktienanalyse des Analysten George Topping von Industrial Alliance Securities:
Laut einer Aktienanalyse spricht Analyst George Topping vom Investmenthaus Industrial Alliance Securities im Rahmen einer Ersteinschätzung eine spekulative Kaufempfehlung für die Aktien des Goldproduzenten Barkerville Gold Mines Ltd. (ISIN: CA0676421088, WKN: A0YJSZ, Ticker-Symbol: IWUB, TSE-V Symbol: BGM) aus.
Barkerville Gold Mines Ltd. sei wieder neu belebt worden, nachdem Investoren dem vorherigen Management ablehnend gegenüber gestanden hätten.
Der Wert von Barkerville Gold Mines leite sich aus dem Erfolg oder Misserfolg der Explorationsaktivitäten ab. Angesichts der bislang positiven Ergebnisse sei Erfolge wesentlich wahrscheinlicher als Fehlschläge, so die Einschätzung des Analysten George Topping.
In ihrer Barkerville Gold Mines-Aktienanalyse nehmen die Analysten von Industrial Alliance Securities die Coverage mit dem Votum "speculative buy" und einem Kursziel von 1,50 CAD auf.
Kurzprofil Barkerville Gold Mines Ltd.:
Barkerville Gold Mines Ltd. (ISIN: CA0676421088, WKN: A0YJSZ, Ticker-Symbol: IWUB, TSE-V Symbol: BGM) ist ein kanadisches Unternehmen mit Sitz in Toronto. Das Tätigkeitsspektrum umfasst die Produktion und den Verkauf von Gold sowie die Exploration, Entwicklung und Akquisition von Mineralvorkommen in British Columbia. Barkerville Gold Mines kontrolliere rund 117.440 Hektar, inklusive der drei zusammenhängender mineralhaltiger Liegenschaften Cariboo Group, Island Mountain Group und Mosquito Creek Group. (13.09.2017/ac/a/a)
http://www.aktiencheck.de/exklusiv/Artikel-Neueinschaetzung_…
http://barkervillegold.com/2017/09/bgm-intersects-17-45-gt-a…
BGM INTERSECTS 17.45 G/T AU OVER 8.60 METRES AT SHAFT ZONE
Freundliche Grüße
supernova
BGM INTERSECTS 17.45 G/T AU OVER 8.60 METRES AT SHAFT ZONE
Freundliche Grüße
supernova
Globe says Barkerville Gold has been "reinvigorated"
Zitat :
"Barkerville's value will be derived from its exploration success or failure. Given the positive results to date, we believe success is the much more probable outcome. We note valuations on resource companies tend to vary between 5-10 per cent of the in-situ value of the resource. If we choose a value in between those end points, the current enterprise value of $244-million would require a 2.5Moz resource valued at $100/oz to support it. We believe an updated resource estimate including Cow Mountain and Island Mountain should handily exceed this number. A management team accustomed to rapid exploration and development, combined with technical know-how and excellent drilling results to date, should drive fund flow into BGM."
quelle:
https://www.stockwatch.com/News/Item.aspx?bid=Z-C:BGM-250491…
Auch intressant da ja bekanntlich BGM ja mit Osisko zusammenarbeitet :
http://www.gowebcasting.com/events/precious-metals-summit-co…" target="_blank" rel="nofollow ugc noopener">
http://www.gowebcasting.com/events/precious-metals-summit-co…
http://www.gowebcasting.com/events/precious-metals-summit-co…" target="_blank" rel="nofollow ugc noopener">
http://www.gowebcasting.com/events/precious-metals-summit-co…
BGM INTERSECTS 72.23 G/T AU OVER 12.05 METRES AT SHAFT ZONE Erneut tolle Bohrresultate!
http://barkervillegold.com/2017/09/bgm-intersects-17-45-gt-a…

unglaulich,solche news und nichts passiert.
in zwei jahren werden alle wieder bei 20 euro kaufen.
es ist immer das gleiche die masse will es nicht wenn es billig ist.
da können die news noch so gut sein.bleibt stark der wind wird rau die nächsten jahre
da kann eine barkerville einem den arsch retten.
in zwei jahren werden alle wieder bei 20 euro kaufen.
es ist immer das gleiche die masse will es nicht wenn es billig ist.
da können die news noch so gut sein.bleibt stark der wind wird rau die nächsten jahre
da kann eine barkerville einem den arsch retten.
BARKERVILLE COMPLETES $35 MILLION FINANCING OF COMMON AND FLOW-THROUGH SHARES
http://barkervillegold.com/2017/09/barkerville-completes-35-…
http://barkervillegold.com/2017/09/barkerville-completes-35-…
und Osisko mal wieder ganz vorne dabei , das gefällt mir !!!!
Hallo die Market cap von Marktkap.
309,91 Mio.
Ist natürlich verdammt stark ich weiss natürlich auch das diese Hohe Market cap wegen der Recourcen und den guten Bohrergebnissen kommt...
Aber wenn Barkerville Gold die 50 000 Unzen pro Jahr schafft was ist bei solch einen Produzenten eine faire Market cap?
309,91 Mio.
Ist natürlich verdammt stark ich weiss natürlich auch das diese Hohe Market cap wegen der Recourcen und den guten Bohrergebnissen kommt...
Aber wenn Barkerville Gold die 50 000 Unzen pro Jahr schafft was ist bei solch einen Produzenten eine faire Market cap?
WAS ist fair , ist eine gute Frage ...
wenn man erst am Anfang der Erkundung steht , hier wird die Zukunft gehandelt und für mich ist die Zusammenarbeit mit Osisko eine Hauptargument, neben den angeblich bis zu 90 Mio Unzen das ich hier postiv bleibe.
PS : gibt es irgendwo im Netz eine Tabelle wo man die Marktcap per Unze bei Produzenten vergleicht? würde mich mal intressieren , hast Du da was @ freddy
Antwort auf Beitrag Nr.: 55.857.231 von senna7 am 30.09.17 16:21:05
Evaluieren kann man das nur sehr schwer.
BGM wird in den nächsten Wochen ein Update zur Produktion in der QR Mill bringen, innerhalb des nächsten halben Jahres vermute ich ein Ressourcenupdate. Sollte das Richtung 3 - 4 Mio Unzen gehen, kann man sich vorstellen, dass die Market Cap bestätigt wird.
Falls es höher geht, kann sich ja jeder selbst vorstellen, was passieren wird.
Mir stellt sich dann nur noch die Frage, was überhaupt in die neue Ressourcenschätzung hineinläuft. Gibt ja angelblich einen Stau bei der chemischen Analyse von Bohrkernen, der mehr als nur 4 Wochen Verschiebung bedeutet...
Keine Ahnung wo es hinführt. Lesen kann man viel, aber leider meist nur Vermutungen...
bei Produzenten
geht man aktuell davon aus, dass profitabel förderbare Ressourcen mit ca. 100 USD pro Unze bezahlt werden. Das hört man in den diversen Foren. Hängt dann noch ein bisschen vom final möglichen Profit ab.Evaluieren kann man das nur sehr schwer.
BGM wird in den nächsten Wochen ein Update zur Produktion in der QR Mill bringen, innerhalb des nächsten halben Jahres vermute ich ein Ressourcenupdate. Sollte das Richtung 3 - 4 Mio Unzen gehen, kann man sich vorstellen, dass die Market Cap bestätigt wird.
Falls es höher geht, kann sich ja jeder selbst vorstellen, was passieren wird.
Mir stellt sich dann nur noch die Frage, was überhaupt in die neue Ressourcenschätzung hineinläuft. Gibt ja angelblich einen Stau bei der chemischen Analyse von Bohrkernen, der mehr als nur 4 Wochen Verschiebung bedeutet...
Keine Ahnung wo es hinführt. Lesen kann man viel, aber leider meist nur Vermutungen...
Gestern schöner Anstieg in Kanada. Wissen da einige evtl. schon mehr als wir? Wäre natürlich schön, wenn bald eine Meldung bezüglich angelaufener Produktion erscheinen würde.
für mich ist das charttechnisch begründet da bei 0,80 eine starke Haltezone ist
über 0,90 kann ers auch wieder richtig hochgehen ...

über 0,90 kann ers auch wieder richtig hochgehen ...
BGM Intersects 20.53 G/T AU Over 11.60 Metres at Shaft Zone
und weiter gehts...http://www.minenportal.de/artikel.php?sid=214132&lang=en#BGM…
das sind natürlich sehr gute Treffer
zwischen 11 & 87 Gramm na da haben wieder ein paar gestern schon mehr gewußt ....kennt man ja ...
http://barkervillegold.com/2017/10/barkerville-completes-35-…
zwischen 11 & 87 Gramm
na da haben wieder ein paar gestern schon mehr gewußt ....kennt man ja ...http://barkervillegold.com/2017/10/barkerville-completes-35-…
BGM INTERSECTS 20.53 G/T AU OVER 11.60 METRES AT SHAFT ZONE
Neue Bohrnews!http://barkervillegold.com/2017/10/barkerville-completes-35-…
Hab ich etwas verpasst?
Die Bohrergebnisse waren doch gut, oder
Die Bohrergebnisse waren doch gut, oder
gestern wars noch schlimmer. hmm keine ahnung was hier los ist. hoffe es kommt bald wieder etwas beruhigung rein hier.
Antwort auf Beitrag Nr.: 55.970.391 von kubisander22 am 18.10.17 07:30:59
Meine Hoffnung ist : "Bäumchen schüttel dich"!
Die Angst aus der Aktie nehmen.
Zitat von kubisander22: gestern wars noch schlimmer. hmm keine ahnung was hier los ist. hoffe es kommt bald wieder etwas beruhigung rein hier.
Meine Hoffnung ist : "Bäumchen schüttel dich"!
Die Angst aus der Aktie nehmen.
Die schwachen Hände müssen rausgekehrt werden.
Lg
hbc002
Lg
hbc002
da wurden wohl ein paar Stopps bei 0,79 -0,80 ausgelöst oder soll man " schwache Hände " sagen

könnte nun aber wieder nach oben drehen

könnte nun aber wieder nach oben drehen
Falls noch nicht gelesen - denke da kommt jetzt Ruhe rein
http://us11.campaign-archive.com/?e=fad3b464e0&u=3204f2d2592…
http://us11.campaign-archive.com/?e=fad3b464e0&u=3204f2d2592…
http://barkervillegold.com/2017/10/barkerville-completes-35-…
BGM INTERSECTS 35.20 G/T AU OVER 4.00 METRES AT SHAFT ZONE
BETA CORRIDOR CONTINUES TO EXPAND – 17.65 G/T AU OVER 6.70 METRES
TORONTO, ON – October 31st, 2017
...
Freundliche Grüße
supernova
BGM INTERSECTS 35.20 G/T AU OVER 4.00 METRES AT SHAFT ZONE
BETA CORRIDOR CONTINUES TO EXPAND – 17.65 G/T AU OVER 6.70 METRES
TORONTO, ON – October 31st, 2017
...
Freundliche Grüße
supernova
genug rumkonsolidiert heute mit über 1,3 Mio Stücke Umsatz rauf
Stücke Umsatz rauf
BGM INTERSECTS 29.26 G/T AU OVER 4.45 METRES AT SHAFT ZONE
TORONTO, ON – November 8th, 2017 – Barkerville Gold Mines Ltd. (TSXV: BGM) (the “Company” or “Barkerville”) is pleased to announce additional drilling results from the ongoing 160,000 metre Phase II Island Mountain exploration and infill drilling program at the Company’s flagship Cariboo Gold Project. The Company is currently exploring and delineating the Valley and Shaft Zones with nine drill rigs, while a tenth drill is expanding the known mineralization on the BC Vein. Detailed drilling results, a drill hole location plan map and vertical sections are presented at the end of this release. The exact geometry and hence true width of the mineralized zones cannot be assuredly concluded at this time therefore core lengths are reported.
Beta Corridor Continues to Demonstrate Continuity
The Company is pleased to announce that the ongoing infill drilling on the Beta Corridor continues to demonstrate grade and geological continuity. Phase II drillhole IM-17-180 predictably intersected veining in the Beta Corridor averaging 29.26 g/t Au over 4.45 metres at a vertical depth of 410 metres below surface and is situated 20 metres southwest along corridor strike from previously disclosed drillhole
IM-17-044 which intersected 24.70 g/t Au over 6.60 metres. New mineralization at depth was also demonstrated by IM-17-180 having pierced veining grading 17.91 g/t Au over 2.85 metres at a depth of 510 metres below surface. The Beta Corridor remains open for expansion to depth.
On the southeastern flank of the Shaft Zone, Phase II drillhole IM-17-174-1 intersected 32.02 g/t Au over 3.90 metres in an area of low drilling density, situated 110 metres below surface. This same drillhole also pierced a larger network of veining with subintervals grading 107.50 g/t Au over 0.50 metres, 11.03 g/t Au over 1.65 metres and 11.15 g/t Au over 3.45 metres. Additional drilling is planned in this largely unexplored portion of the Shaft Zone to determine the potential for another veining corridor.
Shaft Zone – Corridors Discussion
The sandstone hosted veining which constitutes the newly named Alpha, Beta and Gamma Corridors of the Shaft Zone are manifested as an anastomosing network of high vein density with an overall sub-vertical dip and northeast strike. Based upon drilling results to date, estimated horizontal widths of the corridors are variable and range from 5 to 35 metres. These corridors, as well as others that are developing in the Shaft and Valley Zones have been defined from surface to a vertical depth of 600 metres and remain open for expansion to depth and down plunge. Drillhole spacing in the corridors currently averages 25 metres between drilling sections with vertical drilling separations ranging from 20 to 75 metres with hole spacing increasing to depth. Gold grades are intimately associated with vein-hosted pyrite as well as pyritic, intensely silicified wall rock haloes in close proximity to the veins.
Qualified Persons
Exploration activities at the Cariboo Gold Project are administered on site by the Company’s Exploration Manager, Maggie Layman, P.Geo. As per National Instrument 43-101 Standards of Disclosure for Mineral Projects, Paul Geddes, P.Geo. Vice President Exploration, is the Qualified Person for the Company and has prepared, validated and approved the technical and scientific content of this news release. The Company strictly adheres to CIM Best Practices Guidelines in conducting, documenting, and reporting its exploration activities on the Cariboo Gold Project.
Quality Assurance – Quality Control
Once received from the drill and processed, all drill core samples are sawn in half, labelled and bagged. The remaining drill core is subsequently stored on site at the Company’s secure facility in Wells, BC. Numbered security tags are applied to lab shipments for chain of custody requirements. The Company inserts quality control (QC) samples at regular intervals in the sample stream, including blanks and reference materials with all sample shipments to monitor laboratory performance. The QAQC program was designed and approved by Lynda Bloom, P.Geo. of Analytical Solutions Ltd., and is overseen by the Company’s Qualified Person, Paul Geddes, P.Geo, Vice President Exploration.
Drill core samples are submitted to ALS Geochemistry’s analytical facility in North Vancouver, British Columbia for preparation and analysis. The ALS facility is accredited to the ISO/IEC 17025 standard for gold assays and all analytical methods include quality control materials at set frequencies with established data acceptance criteria. The entire sample is crushed and 250 grams is pulverized. Analysis for gold is by 50g fire assay fusion with atomic absorption (AAS) finish with a lower limit of 0.01 ppm and upper limit of 100 ppm. Samples with gold assays greater than 100 ppm are re-analyzed using a 1,000g screen metallic fire assay. A selected number of samples are also analyzed using a 48 multi-elemental geochemical package by a 4-acid digestion, followed by Inductively Coupled Plasma Atomic Emission Spectroscopy (ICP-AES) and Inductively Coupled Plasma Mass Spectroscopy (ICP-MS).
For further information on Barkerville Gold Mines Ltd. please contact:
Chris Lodder
President & Chief Executive Officer
155 University Avenue, Suite 1440
Toronto, Ontario, Canada
clodder@barkervillegold.com
http://barkervillegold.com/2017/11/barkerville-completes-35…
Freundliche Grüße
supernova
Antwort auf Beitrag Nr.: 56.134.013 von supernova1712 am 08.11.17 17:33:16Leider immer noch keine News bezüglich Produktion. Die letzten beiden Tage waren nicht schön anzusehen. Hoffe es geht hier bald wieder einmal in die andere Richtung ansonsten sind wir bald wieder bei den Preisen vor dem grossen Anstieg.
Zumindest heute im Investor Magazin wird wieder einmal über Barkerville berichtet. Hört sich nicht schlecht an aber eine riesen Euphorie wird der Bericht auch nicht auslösen.
http://investor-magazin.de/download/investor-magazin_2017/In…
http://investor-magazin.de/download/investor-magazin_2017/In…
Antwort auf Beitrag Nr.: 56.138.642 von kubisander22 am 09.11.17 08:55:26
http://barkervillegold.com/wp-content/uploads/2017/11/BGM_NO…
schau mal da rein
auf Seite 17 stehen ein paar Krümel.http://barkervillegold.com/wp-content/uploads/2017/11/BGM_NO…
schönes Interview von Jochen Staiger mit CEO Chriss Lodder
http://www.commodity-tv.net/c/mid,38217,Zuri_Invest_Gala_Nov…
und wieder gute Bohrergebnisse ...
http://barkervillegold.com/2017/11/barkerville-completes-35-…
http://www.commodity-tv.net/c/mid,38217,Zuri_Invest_Gala_Nov…
und wieder gute Bohrergebnisse ...
http://barkervillegold.com/2017/11/barkerville-completes-35-…
Antwort auf Beitrag Nr.: 56.226.044 von senna7 am 20.11.17 14:43:08Hört sich doch alles ganz positiv an. Auch die Bohrergebnisse machen wieder Freude. Bin schon gespannt auf die neue Resourcenschätzung, die ja gemäss Interview ca. im Q1 2018 kommen soll. Nur der Kurs macht nicht so Freude aktuell. Hoffe schwer, dass das Tax loss selling der Grund für den Abwärtstrend war und wir gegen Ende des Jahres und anfang 2018 wieder höhere Kurse sehen.
Interview
Video ab ca. 10:40long life Asset: 20 + years
initial ounzes production: 150.000 - 200.000 p.a.
habt ihr das auch so verstanden ?
Antwort auf Beitrag Nr.: 56.230.196 von bre128 am 20.11.17 21:21:22Ja das habe ich auch so verstanden, obwohl mein Englisch nicht das Beste ist.
Weitere Bohrnews
BGM INTERSECTS 14.69 G/T AU OVER 28.50 METRES AT SHAFT ZONEhttp://barkervillegold.com/2017/11/barkerville-completes-35-…
Alle Bohrnews verpuffen aktuell komplett - die Kursentwicklung ist aktuell alles andere als erfreulich. Wer drückt hier den Kurs oder wo liegen die Gründe für diese Entwicklung? Leider habe ich aktuell auch keine Erklärung dazu. Vielleicht möchte ja Osisko nochmals günstig aufstocken?
Antwort auf Beitrag Nr.: 56.319.749 von kubisander22 am 30.11.17 08:55:40Tax-loss koennte den Kurs noch auf 0,30 druecken, m.E.
Antwort auf Beitrag Nr.: 56.325.992 von Rohstoffinvestor am 30.11.17 16:02:07
Gratuliere allen, die über nen CAD raus sind. Die bekommens voll ab. Sehe hier aktuell auch keinen Halt. Bleibt die Hoffnung dass die 0,5 CAD remsen werden...
Das hier ist einfach nur Bitter
Gratuliere allen, die über nen CAD raus sind. Die bekommens voll ab. Sehe hier aktuell auch keinen Halt. Bleibt die Hoffnung dass die 0,5 CAD remsen werden...
Kopf hoch und langsam Geld auf Seite schieben ....ich werde bei bestimmte Marken zukaufen.

Antwort auf Beitrag Nr.: 56.345.594 von senna7 am 02.12.17 10:58:20Guten Morgen,
wenn man in Deinen Chart noch eine mittelfristige aufsteigende Linie einzieht, hat man sogar einen Schnittpunkt knappunter der 0,60. Das sind für mich schon Nachkaufpunkte.
Gruß und danke für den Chart.
Lenny
wenn man in Deinen Chart noch eine mittelfristige aufsteigende Linie einzieht, hat man sogar einen Schnittpunkt knappunter der 0,60. Das sind für mich schon Nachkaufpunkte.
Gruß und danke für den Chart.
Lenny
Danke @ lenny
du meinst es wohl so oder ?

du meinst es wohl so oder ?
Antwort auf Beitrag Nr.: 56.347.052 von senna7 am 02.12.17 15:32:26Jo...genau so!
Vielen Dank. Momentan funktioniert mein Chart Tool nicht. Ich kann nur Mini Charts hier reinstellen.
Keine Ahnung woran das liegt.
Ich werde jedenfalls bei der Kreuzunterstützung nachkaufen...auch Dank Deiner klasse Analysen(nicht nur hier im Thread ).
Gruß
Lenny
Vielen Dank. Momentan funktioniert mein Chart Tool nicht. Ich kann nur Mini Charts hier reinstellen.
Keine Ahnung woran das liegt.
Ich werde jedenfalls bei der Kreuzunterstützung nachkaufen...auch Dank Deiner klasse Analysen(nicht nur hier im Thread
).Gruß
Lenny
Gibt es nun endlich eine Trendwende? Die Aktie wurde in letzter Zeit doch arg runtergeprügelt. Dies trotz konstant guten News. Ich bin wieder positiv eingestimmt.
Barkerville Announces C$10 Million Bought Deal Private Placement of Flow-Through Shares
http://barkervillegold.com/2017/12/barkerville-completes-35-…
Antwort auf Beitrag Nr.: 56.480.090 von kubisander22 am 18.12.17 15:21:05Zu 1 Dollar, supergut...
Antwort auf Beitrag Nr.: 56.482.766 von ooy am 18.12.17 18:54:13Nicht schlecht, aber warum erhalten die Konsortialbanken 500.00 Cad in bar für ihre "Bemühungen" ???
lt. der Präsentation vom Dezember 2017 waren per Ende Oktober 70 Mio Cash vorhanden.
Somit gibt es eigentlich gar keine Notwendigkeit.
Mittlerweile sind es mit Warrants und Optionen fast 500.000.000 Aktien !!!
Somit gibt es eigentlich gar keine Notwendigkeit.
Mittlerweile sind es mit Warrants und Optionen fast 500.000.000 Aktien !!!
.....Nicht schlecht, aber warum erhalten die Konsortialbanken 500.00 Cad in bar für ihre "
Bemühungen" ??? .....
muss 500.000,00 Cad heißen, sorry
Bemühungen" ??? .....
muss 500.000,00 Cad heißen, sorry
Antwort auf Beitrag Nr.: 56.491.931 von bre128 am 19.12.17 16:12:58Das frag ich mich auch. Gefälligkeit gg.über einigen Banken?
Und warum hört man nichts über den Fortgang der Produktion?
An der Mühle müßte m.E. eigentlich genug Material abgeladen worden sein, damit
über den Winter produziert werden kann. Ein paar Infos dazu von seiten der Firma wären
langsam mehr wie nötig...
PS: Habs nicht mehr auf dem Schirm: Bis wann hat BGM den upgedateten NI43 terminiert?
Nachdem das Management seine Optionen zu einem fairen Kurs erhalten hat, wird es bald Infos geben.
Meines W wird an der neuen Res. Schätzung gearbeitet. Hier entsteht was, brauchen noch Geduld.
Wenn Banken und Großinvestoren immer noch einsteigen ist das ein sehr gutes Zeichen.
LG
hbc002
Meines W wird an der neuen Res. Schätzung gearbeitet. Hier entsteht was, brauchen noch Geduld.
Wenn Banken und Großinvestoren immer noch einsteigen ist das ein sehr gutes Zeichen.
LG
hbc002
Barkerville Gold closes $10.98M financing
https://www.stockwatch.com/News/Item.aspx?bid=Z-C%3aBGM-2551…
https://www.stockwatch.com/News/Item.aspx?bid=Z-C%3aBGM-2551…
BGM INTERSECTS 29.20 G/T AU OVER 5.55 METRES AT SHAFT ZONE
ISLAND MOUNTAIN ALSO YEILDS 16.38 G/T AU OVER 5.80 METRES
TORONTO, ON – January 9th, 2018 – Barkerville Gold Mines Ltd. (TSXV: BGM) (the “Company” or “Barkerville”) is pleased to announce additional drilling results from the 2017 Phase II Island Mountain exploration and infill drilling program at the Company’s flagship Cariboo Gold Project. The Company is currently exploring and delineating the Shaft Zone with five drill rigs. Detailed drilling results, a drill hole location plan map and vertical sections are presented at the end of this release. The exact geometry and hence true width of the mineralized zones cannot be assuredly concluded at this time therefore core lengths are reported. ....
http://barkervillegold.com/2018/01/barkerville-completes-35-…
Freundliche Grüße
supernova
Vor 10 Jahren lag der Kurs noch bei ca. 2 € und bis heute hater ca. 75 % eingebüßt.
Wann sollte es denn wieder nach oben gehen. Kann das nach den jetzt veröffentlichten Bohrergebnissen die Trendwende sein ?
Wer weiß mehr über dieses Unternehmen ?
Wann sollte es denn wieder nach oben gehen. Kann das nach den jetzt veröffentlichten Bohrergebnissen die Trendwende sein ?
Wer weiß mehr über dieses Unternehmen ?
Antwort auf Beitrag Nr.: 56.672.267 von boersentrader02 am 10.01.18 12:12:00
Barkerville drills 5.55 m of 29.2 g/t Au at Cariboo
2018-01-09 07:32 ET - News Release
Mr. Chris Lodder reports
BGM INTERSECTS 29.20 G/T AU OVER 5.55 METRES AT SHAFT ZONE
Barkerville Gold Mines Ltd. has released additional drilling results from the 2017 phase 2 Island Mountain exploration and infill drilling program at the company's flagship Cariboo gold project. The company is currently exploring and delineating the Shaft zone with five drill rigs. Detailed drilling results, a drill hole location plan map and vertical sections are presented on the company's website. The exact geometry and hence true width of the mineralized zones cannot be assuredly concluded at this time therefore core lengths are reported.
Drilling highlights:
IM-17-196: 16.38 grams per tonne gold over 5.80 metres;
IM-17-198: 5.20 g/t Au over 6.25 metres;
IM-17-202: 29.20 g/t Au over 5.55 metres;
IM-17-205: 8.21 g/t Au over 4.85 metres.
Continued expansion of vein corridors
https://www.stockwatch.com/News/Item.aspx?bid=Z-C%3aBGM-2554…
Da der Link von supernova nicht funktioniert stelle ich hier die News von stockwatch einfach
noch einmal rein. Es liest sich zumindest nicht schlecht, warten wir ab was die weiteren Veröffentlichungen der Bohrergebnisse ergeb en werden ? Barkerville drills 5.55 m of 29.2 g/t Au at Cariboo
2018-01-09 07:32 ET - News Release
Mr. Chris Lodder reports
BGM INTERSECTS 29.20 G/T AU OVER 5.55 METRES AT SHAFT ZONE
Barkerville Gold Mines Ltd. has released additional drilling results from the 2017 phase 2 Island Mountain exploration and infill drilling program at the company's flagship Cariboo gold project. The company is currently exploring and delineating the Shaft zone with five drill rigs. Detailed drilling results, a drill hole location plan map and vertical sections are presented on the company's website. The exact geometry and hence true width of the mineralized zones cannot be assuredly concluded at this time therefore core lengths are reported.
Drilling highlights:
IM-17-196: 16.38 grams per tonne gold over 5.80 metres;
IM-17-198: 5.20 g/t Au over 6.25 metres;
IM-17-202: 29.20 g/t Au over 5.55 metres;
IM-17-205: 8.21 g/t Au over 4.85 metres.
Continued expansion of vein corridors
https://www.stockwatch.com/News/Item.aspx?bid=Z-C%3aBGM-2554…
2017 Corporate Update and 2018 Objectives
January 12, 2018
Cariboo Gold Project
Brownfield Exploration
Barkerville’s 2017 Exploration program was focused on it’s flagship Cariboo Gold Project located within Central British Columbia. The company completed a 157,000 meter drilling campaign focused on resource delineation and expansion drilling on Cow and Island Mountain, with the majority focused on the Valley Zone and Shaft Zone. Significant high-grade intercepts confirmed the mineralization model, grade continuity, and geometries. Some significant recent drill intercepts are as follows: 72.23g/t over 12.05m, 53.26g/t over 11.55m, 18.84g/t over 30.85, 14.69 g/t over 28.5m, and 20.53 g/t over 11.6m. Barkerville was able to identify and wire frame 145 vein corridors which will be the base for the resource estimate in 2018.
Greenfield Exploration
Barkerville’s greenfield exploration team was tasked with developing targets to the southeast of the of the central project area along the 67 kilometers of strike within the company’s Cariboo Gold Project. Systematic, scientific exploration was able to identify 130 new targets through detailed mapping, soil, and rock sampling. Eleven of these are now at the drill ready stage.
Operations (Bonanza Ledge)
Portal and underground development began in the second semester of 2017 at the Bonanza Ledge mine. Barkerville completed 470 meters of underground development in 2017. Approximately 7000 tonnes of both low and high-grade development material was processed at the company’s 100% owned QR mill for commissioning and training purposes. The Mill will be restarted in March 2018 when a sufficient stockpile is on site at QR.
2018 Objectives
In 2018 the company is planning to undertake several actions which are anticipated to be substantial catalysts for Barkerville. We plan to publish an initial resource for Cow Mountain, Island Mountain and Valley Zones as well as an update for Barkerville Mountain,. Barkerville will initiate drill testing of regional targets to confirm the mineralization model and district scale upside. Bonanza Ledge anticipates finishing development in Q1 with stope production to follow. The company will also start its underground access, permit depending, in order to explore for increased underground resources at Cow and Island Mountain targets. This should reduce future drilling cost and improve our understanding of the mineralization. This underground access will also allow for trial stoping and bulk sampling that will supply valuable data related to rock mechanics, dilution, operating costs and processing.
Management Change
Effective March 1st, 2018, Maggie Layman, currently Barkerville’s Exploration Manager, will replace Paul Geddes as Vice President Exploration and QP for the Cariboo Gold Project. Paul will be pursuing other opportunities in British Columbia and the Company would like to thank him for his contributions to the Cariboo Gold Project and wish him all the best in his future endeavors.
Maggie has worked in mineral exploration with several other Major and Junior companies managing Brownfields and Greenfields gold and base metal exploration programs throughout Canada since 2006. Maggie has worked for BGM since 2015 and is responsible for directing the exploration programs at the Cariboo Gold Project. She is an active volunteer with the Association of Mineral Exploration Aboriginal Relations Committee. Maggie is a graduate from Memorial University of Newfoundland Earth Science program and is a P.Geo and member in good standing with APEGBC in British Columbia. She is the Qualified Person (QP) for BGM in accordance with National Instrument 43-101 Standards of Disclosure for Mineral Projects.
http://barkervillegold.com/2018/01/2017-corporate-update-and…
Möglicherweise ist das der Grund
warum hier nichts geht, und nicht weiterproduziert wird...theprovince.com/pmn/news-pmn/canada-news-pmn/mining-company-fined-200000-for-dumping-waste-in-b-c-river-system/wcm/cc8033a4-f1a4-4e11-a352-64d56d2b511b
Lässt sich sicherlich lösen. Mir ist auch nicht klar, ob diese Liegenschaft langfristig zur Produktion vorgesehen ist. Fakt ist aber, jetzt gibt es erst mal Stress...
Diese Deppen ...sowas macht man nicht ....
Antwort auf Beitrag Nr.: 56.777.193 von senna7 am 20.01.18 16:23:29Da stimme ich zu. Sowas geht gar nicht!
Diese Meldung hat mich wirklich sehr verärgert! Was hat sich Barkerville dabei nur gedacht? Es ist eine riesen Freichheit und stinkt zum Himmel! Das fängt ja schon gut an, kaum ein paar Unzen produziert und schon in den Negativschlagzeilen. Hoffe sie lernen daraus und verhalten sich in Zukunft etwas cleverer.
Es gibt auch erfreuliches zu berichten:
BGM INTERSECTS 12.40 G/T AU OVER 7.00 METRES AT SHAFT ZONE
INFILL DRILLING INTERSECTS 7.28 G/T AU OVER 12.50 METRES
...
http://barkervillegold.com/2018/01/bgm-intersects-12-40-g-t-…" target="_blank" rel="nofollow ugc noopener">http://barkervillegold.com/2018/01/bgm-intersects-12-40-g-t-…
Freundliche Grüße
supernova
Hallo Leute hier mal etwas zum lesen hoffentlich produziert Barkerville Gold Mines ordentlich Gold die nächste Krise kommt bestimmt....
https://www.goldseiten.de/artikel/364132--Warum-die-naechste…
https://www.goldseiten.de/artikel/364132--Warum-die-naechste…
Hallo es gibt ein aktuelles Interview falls noch nicht bekannt
https://www.commodity-tv.net/?v=298009
https://www.commodity-tv.net/?v=298009
das ist doch alt!
Barkerville ist wohl einer der heißesten Gold-Plays in Kanada!
Hier das neueste Video mit dem CEO:
Hier das neueste Video mit dem CEO:
und weiterhin gute Bohrergebnisse ...
aber zur Zeit ist überall der Wurm drin bei den EM Aktien .... aber das wird auch wieder besser ....
https://www.stockwatch.com/News/Item.aspx?bid=Z-C%3aBGM-2590…
...aber zur Zeit ist überall der Wurm drin bei den EM Aktien ....
aber das wird auch wieder besser ....https://www.stockwatch.com/News/Item.aspx?bid=Z-C%3aBGM-2590…
auch die sind gut ...
Barkerville drills 14.55 m of 24.16 g/t Au at Cariboo
Drilling highlights:
IM-18-001: 101.98 grams per tonne gold over 2.15 metres;
IM-18-001: 7.65 g/t Au over 10.60 metres;
IM-18-005: 14.69 g/t Au over 15.80 metres;
IM-18-006: 10.87 g/t Au over 6.00 metres;
IM-18-006: 24.16 g/t Au over 14.55 metres;
IM-18-009: 52.65 g/t Au over 2.50 metres;
IM-18-010: 19.64 g/t Au over 3.85 metres;
IM-18-019: 11.35 g/t Au over 6.30 metres;
IM-18-022 34.57 g/t Au over 4.20 metres.
https://www.stockwatch.com/News/Item.aspx?bid=Z-C%3aBGM-2592…
na kommt nun die Trendwende , es wäre uns zu wünschen ....

In Canada wird auf gute Nachrichten Mitte Mai gerechnet & ich nehme an das deswegen nun der Kurs dreht
Antwort auf Beitrag Nr.: 57.540.351 von senna7 am 13.04.18 20:29:02Habe mir heute mal die Zeit genommen und in den Foren nach Meinungen zu Barkerville Gold gesucht.
Unabhängig von der Charttechnik und dem zu erwartenden mittelprächtigen bis fulminanten Anstieg des Goldpreis (spätestens mit Beginn des Herbstes 2018), erwarten viele Interessenten eine gute, bis sehr gute aktualisierte Ressourcenschätzung in den nächsten 6 Wochen.
Die daraufhin beginnende, effiziente Goldgewinnung (Erhöhung d. Strip Ratio) auf Bonanza Ledge wird sicherlich so ergiebig sein , dass die restlichen Explorationskosten für das Gesamtgebiet bis 2020 gedeckt sind.
Und dann besitzt man wohl eines der gehaltreichsten Abbaugebiete in B.C....
Ein Träumchen...würde Horst Lichter (Bares für Rares) wohl formulieren.
DYOR

Antwort auf Beitrag Nr.: 57.600.963 von iwanowski am 22.04.18 15:35:31Ich erwarte hier auch noch positive Entwicklung - vielleicht schon dieses Jahr.
Ob es aber jetzt schon aufwärts geht?
Bei einer weiteren Schwäche würde ich ggf. auch nochmal nachlegen.
Ob es aber jetzt schon aufwärts geht?
Bei einer weiteren Schwäche würde ich ggf. auch nochmal nachlegen.

BGM DEFINES COW AND ISLAND MOUNTAINS MAIDEN UNDERGROUND RESOURCE AND BARKERVILLE MOUNTAIN UPDATE
1.60 MILLION OUNCES TOTAL MEASURED AND INDICATED AND 2.16 MILLION OUNCES INFERREDhttp://barkervillegold.com/2018/05/bgm-defines-cow-and-islan…
Eure Meinungen zur oben genannten News?
Antwort auf Beitrag Nr.: 57.682.524 von kubisander22 am 03.05.18 07:40:23Die Aussage von CEO Chris Lodder hört sich mal nicht schlecht an...
Chris Lodder, President and CEO of BGM commented, “The discovery of this initial, robust, underground resource coupled with our planned exploration decline at Cow and Island Mountain as well as unparalleled potential for significant resource expansion at depth and on strike, places BGM on a path to become a significant gold mining company in Western Canada.”
Chris Lodder, President and CEO of BGM commented, “The discovery of this initial, robust, underground resource coupled with our planned exploration decline at Cow and Island Mountain as well as unparalleled potential for significant resource expansion at depth and on strike, places BGM on a path to become a significant gold mining company in Western Canada.”
Antwort auf Beitrag Nr.: 57.682.764 von kubisander22 am 03.05.18 08:14:27hmmm ok die meldung scheint nicht gut anzukommen am markt....frage mich warum, hat jemand evtl. ein bisschen mehr ahnung wo das problem liegen könnte? wurde einfach mehr erwartet als nun veröffentlicht wurde?
Antwort auf Beitrag Nr.: 57.687.138 von kubisander22 am 03.05.18 16:03:32Ich bin kein Spezialist. Meiner Meinung nach steht nichts negatives in der Präsentation. Man könnte die Bewegung als sell-on-good-news interpretieren oder der Markt hatte höhere Erwartungen in die Ergebnisse und wurde enttäuscht? Was es letzten Endes wirklich ist kann ich nicht sagen.
Ich persönlich finde die Ergebnisse okay. Es ist nichts dramatisch gutes dabei, aber schlecht ist das auch nicht. Wenn ein Producer Bohrprogramme auflegt und am Ende kommt was dabei raus, was den weiteren Betrieb sichert, ist das IMO immer positiv zu werten - es geht weiter.
Mit Zukäufen warte ich ab, wie sich der Sektor im Ganzen weiter entwickelt. Bei einer allgemeinen Schwäche im Sektor über den Sommer würde ich hier bei gutem Kurs auch nochmal nachlegen.
Für mich eindeutig eine Sektorschwäche und für mich auch Kaufkurse.
Antwort auf Beitrag Nr.: 57.694.107 von senna7 am 04.05.18 11:47:47
solide nennt man das wohl
es geht Richtung 4 Mio Unzen, von da aus leicht in alle Richtungen erweiterbar. Was will man mehr?
Barkerville Gold Mines: Zusätzliche Bohrergebnisse von Island Mountain
https://www.minenportal.de/artikel.php?sid=38954
https://www.minenportal.de/artikel.php?sid=38954
Antwort auf Beitrag Nr.: 57.724.246 von senna7 am 09.05.18 09:31:59
Ich verstehe nicht, warum BGM im Moment so stark underperformt und gegen den Markt fällt.
Andere Minen wie Silver Lake, Teranga, Argonaut usw. sind zwischen 40-80% nach oben gelaufen während BGM am Tief verharrt.
Gleiches gilt übrigens für Falco, wo ebenfalls das Osisko Team am Ruder ist.
Kann sich von euch jemand den schlechten Kursverlauf erklären - an den News kann es wohl nicht liegen?
ich versteh es auch nicht .... es ist als wäre ein Fluch auf de Aktie ...
trotzdem ich geb kein Stück her ..irgendwann endecken uns die "großen Anleger " auch mal wieder .....
trotzdem ich geb kein Stück her ..irgendwann endecken uns die "großen Anleger " auch mal wieder .....
Bohrlöcher wie zuletzt mit über 20 - ca 80 Gramm sind hervorragend .... sowas findet nicht jeder
Antwort auf Beitrag Nr.: 57.726.649 von senna7 am 09.05.18 13:43:25
Fazit: die Phantasie ist erst mal raus, ich wüsste nicht, was der Aktie Auftrieb geben könnte, außer vielleicht ein Abfindungsangebot von Osisko an die Kleinaktionäre. Kommt da bis Jahresultimo nichts, werde ich (wohl mit Verlust) rausgehen.
Der Markt vergisst vielleicht doch nicht so schnell
...vor Jahren wurden um Faktor 10 höhere Ressourcen geschätzt. Auch wenn damals Zweifel aufkamen: Dagegen nehmen sich die neuesten Hochrechnungen doch bescheiden aus. Auch wurde damals, wenn ich mich richtig erinnere, der Eindruck erweckt, man könne kostengünstig im Tagebau schürfen. Und mit den nun avisierten 30 koz pa ist nicht das erhoffte große Geld (für die Anleger) zu machen. Wenn es gut geht, reichen die Erträge, um das weitere Bohrprogramm zu finanzieren. Fazit: die Phantasie ist erst mal raus, ich wüsste nicht, was der Aktie Auftrieb geben könnte, außer vielleicht ein Abfindungsangebot von Osisko an die Kleinaktionäre. Kommt da bis Jahresultimo nichts, werde ich (wohl mit Verlust) rausgehen.
@ crossrunner
du vergißt das die Verantwortlichen von damals jetzt nicht mehr dabei sind ....
du vergißt das die Verantwortlichen von damals jetzt nicht mehr dabei sind ....
Antwort auf Beitrag Nr.: 57.731.965 von senna7 am 10.05.18 09:40:04
Damals hatte ich einige OSK verkauft. Leider nicht alle. Insbesondere BGM wäre gut gewesen abzustoßen. Im Moment sehe ich da ohne anziehenden Goldpreis keine "steile Karriere".
Mittel bis langfristig eher, da dort nach meiner Ansicht relativ schnell eine größere Goldresource nachgewiesen werden könnte.
Gut ist, dass ich nicht immer richtig liege
Ich hatte in diversen Gesprächen
von früheren Geschäftspartnern vom OSK Team herausgehört, dass die Oberen dort ziemlich aalglatt sind, und sich um Aktionäre oder Shareholdervalue wenig scheren. Man solle schöne Gewinne mitnehmen, und nicht auf die Personen setzen. Damals hatte ich einige OSK verkauft. Leider nicht alle. Insbesondere BGM wäre gut gewesen abzustoßen. Im Moment sehe ich da ohne anziehenden Goldpreis keine "steile Karriere".
Mittel bis langfristig eher, da dort nach meiner Ansicht relativ schnell eine größere Goldresource nachgewiesen werden könnte.
Gut ist, dass ich nicht immer richtig liege
Antwort auf Beitrag Nr.: 57.731.965 von senna7 am 10.05.18 09:40:04
Heute hat Osisko als Ankeraktionär die faktische Mehrheit und Barkerville ein von ihnen bestimmtes Management. Die Interessen der Kleinanleger werden mit Sicherheit nicht betont.
Errare humanum est...
Woher weißt du, was ich vergesse? Ich habe die Historie 2012 ff. ziemlich gut dokumentiert. Noch in einer Präsentation von Ende 2014 haben der damalige CEO Frank Callaghan und sein Chefgeologe Jim Yin ein Ressourcenpotential von bis zu 30 Mio oz genannt und damit eine wirklich große Karotte rausgehängt. Damit haben sie zwar letztlich Investoren wie Eric Sprott (mit recht merkwürdigen Abmachungen) auf den Plan gelockt, aber auch die Börsenaufsicht, die bald zu dem Schluss kam, dass die Ressourcenschätzung nicht nach den Regeln des NI 43-101 erfolgt war. Nicht toll für die Kleinanleger: Kurs ausgesetzt und den beiden Koryphäen schließlich der Stecker gezogen. Heute hat Osisko als Ankeraktionär die faktische Mehrheit und Barkerville ein von ihnen bestimmtes Management. Die Interessen der Kleinanleger werden mit Sicherheit nicht betont.
eben sag ich doch ....
Frank Callaghan ist nicht mehr da und Osisko hat das Sagen ....
Frank Callaghan ist nicht mehr da und Osisko hat das Sagen ....
Antwort auf Beitrag Nr.: 57.750.472 von senna7 am 13.05.18 20:59:25Leider ist bei mir gestern der Geduldsfaden gerissen und ich bin hier ausgestiegen. Immerhin mit einem Gewinn, hätte die Aktie viel früher schon verkaufen sollen, dann hätte ich einen Verdoppler verkauft. Obwohl ich denke, dass Barkerville eines Tages weit mehr wert sein wird, glaube ich, dass es zum aktuellen Zeitpunkt die richtige Entscheidung war. Und was in einem Jahr ist kann ja eh keiner voraussagen, daher nicht über verpasste Gewinne ärgern sondern über den aktuellen Gewinn freuen.
Allen die noch investierte sind wünsche ich natürlich steigende Kurse. Ich werde die Aktie weiterhin im Auge behalten.
Allen die noch investierte sind wünsche ich natürlich steigende Kurse. Ich werde die Aktie weiterhin im Auge behalten.
Antwort auf Beitrag Nr.: 57.811.817 von kubisander22 am 23.05.18 07:35:40Glückwunsch! Wohl die Wenigsten sind in der Lage, derzeit mit Gewinn aussteigen zu können. Wohl auch von daher die vielen Zweck-Optimismen.
Antwort auf Beitrag Nr.: 57.813.314 von Crossrunner am 23.05.18 10:41:11Naja - war ja ne Weile um die 15 Eurocent, oder? Wenn man da eingestiegen ist, hat man immer noch verdoppelt. Wenn man so wie ich weiter oben eingestiegen ist und zu 0,15Euro-Zeiten andere Werte verbilligt hat, der wird natürlich schwerlich ohne Verlust raus kommen.
http://barkervillegold.com/2018/06/infill-drilling-intersect…
INFILL DRILLING INTERSECTS 13.07 G/T AU OVER 12.00 METERS ON ISLAND MOUNTAIN
BGM INFILL PROGRAM RELEASES ADDITIONAL HIGH-GRADE INTERCEPTS
INCLUDING 392.0 G/T AU OVER 0.50 METER AND 172.0 G/T AU OVER 0.50 METER WITH VISIBLE GOLD
TORONTO, ON – June 27, 2018 – Barkerville Gold Mines Ltd. (TSXV: BGM) (the “Company” or “Barkerville”) is pleased to announce additional drilling results from the 50,000-meter 2018 Island Mountain exploration and delineation program at the Company’s flagship Cariboo Gold Project. Detailed drilling results, a drill hole location plan map and vertical sections are presented at the end of this release. The infill drilling results continue to demonstrate continuity and expansion of modelled vein corridors.
Drilling Highlights
IM-18-048: 22.69 g/t Au over 2.20 meters including 37.00 g/t Au over 0.90 meter;
IM-18-049: 69.90 g/t Au over 0.90 meter;
IM-18-053: 392.00 g/t Au over 0.50 meter;
IM-18-055: 19.37 g/t Au over 2.50 meters including 79.30 g/t Au over 0.50 meter;
IM-18-056: 23.95 g/t Au over 2.10 meters;
IM-18-057: 13.07 g/t Au over 12.00 meters including 16.95 g/t Au over 1.00 meter, 44.70 g/t Au over 0.55 meter and 66.50 g/t over 1.20 meters;
IM-18-060: 12.60 g/t Au over 12.50 meters including 24.50 g/t Au over 1.50 meters and 30.80 g/t Au over 1.00 meter;
IM-18-060: 172.50 g/t Au over 0.50 meter with visible gold observed in quartz veins.
Vein Zone Continuity on Island Mountain
The intervals noted above were intersected in holes designed to infill and expand mineralized vein corridors on Island Mountain down to depths of 500 meters. The program consisted of 50,000 meters drilled in 162 holes, drilled in the Shaft Zone and Mosquito Creek on Island Mountain. Mineralized quartz veins on the Cariboo Gold Project are hosted within the sandstones and are a network of high vein density with an overall sub-vertical dip and northeast strike. These corridors have been defined from surface to a vertical depth of 600 meters and remain open for expansion at depth and down plunge. Gold grades are intimately associated with vein-hosted pyrite as well as pyritic, intensely silicified wall rock haloes in close proximity to the veins.
Qualified Persons
Exploration activities at the Cariboo Gold Project are administered on site by the Company’s Project Geologists, Kyle Orr and Felipe Castaneda. As per National Instrument 43-101 Standards of Disclosure for Mineral Projects, Maggie Layman, P.Geo. Vice President Exploration, is the Qualified Person for the Company and has prepared, validated and approved the technical and scientific content of this news release. The Company strictly adheres to CIM Best Practices Guidelines in conducting, documenting, and reporting its exploration activities on the Cariboo Gold Project.
Quality Assurance – Quality Control
Once received from the drill and processed, all drill core samples are sawn in half, labelled and bagged. The remaining drill core is subsequently stored on site at the Company’s secure facility in Wells, BC. Numbered security tags are applied to lab shipments for chain of custody requirements. The Company inserts quality control (QC) samples at regular intervals in the sample stream, including blanks and reference materials with all sample shipments to monitor laboratory performance. The QAQC program was designed and approved by Lynda Bloom, P.Geo. of Analytical Solutions Ltd., and is overseen by the Company’s Qualified Person, Maggie Layman, P.Geo, Vice President Exploration.
Drill core samples are submitted to ALS Geochemistry’s analytical facility in North Vancouver, British Columbia for preparation and analysis. The ALS facility is accredited to the ISO/IEC 17025 standard for gold assays and all analytical methods include quality control materials at set frequencies with established data acceptance criteria. The entire sample is crushed and 250 grams is pulverized. Analysis for gold is by 50g fire assay fusion with atomic absorption (AAS) finish with a lower limit of 0.01 ppm and upper limit of 100 ppm. Samples with gold assays greater than 100 ppm are re-analyzed using a 1,000g screen metallic fire assay. A selected number of samples are also analyzed using a 48 multi-elemental geochemical package by a 4-acid digestion, followed by Inductively Coupled Plasma Atomic Emission Spectroscopy (ICP-AES) and Inductively Coupled Plasma Mass Spectroscopy (ICP-MS).
...
Freundliche Grüße
supernova
Wie seht ihr die Bohrergebnisse, bitte um Info.
lg
hbc002
lg
hbc002
Antwort auf Beitrag Nr.: 58.319.792 von hbc002 am 27.07.18 17:11:36Wow ist hier der Ofen aus - lol.
Wann kommt eigentlich wieder ein Quartalsbericht raus, damit ich raus finden kann, ob ich hier weiter dabei bleibe oder ob ich hier (mit Verlust) den Stecker ziehe?
Die Bohrergebnisse lesen sich gut, aber ohne einen NI hat man keinen Wert, den man zuordnen kann.
Wie ist das Sentiment im Allgemeinen hier - aussitzen oder aussteigen?
Barkerville Gold Mines meldet neue Bohrergebnisse: 14,7 g/t über 23,6 m
Barkerville Gold Mines Ltd. gab gestern neue Ergebnisse der Explorationsbohrungen am Goldprojekt Cariboo in British Columbia, Kanada, bekannt.
Das insgesamt 50.000 m umfassende diesjährige Bohrprogramm dient der Erkundung und genaueren Abgrenzung der Goldvorkommen im Gebiet Island Mountain, wobei die neusten Ergebnisse Unternehmensangaben zufolge vor allem die Kontinuität und die Ausdehnung der Erzadern in den Zonen Shaft und Mosquito Creek belegen. Die Erzgänge konnten ausgehend von der Tagesoberfläche bislang bis in eine Tiefe von 600 m verfolgt werden und bieten zur Tiefe hin weiteres Explorationspotential.
Zu den Höhepunkten der zuletzt analysierten Bohrkerne zählen u. a. die folgenden Abschnitte:
• Bohrloch IM-18-094: 17,31 g/t Gold über 7,90 m
• Bohrloch IM-18-095: 11,33 g/t Gold über 4,95 m
• Bohrloch IM-18-097: 42,64 g/t Gold über 2,80 m
• Bohrloch IM-18-102: 14,70 g/t Gold über 23,60 m
• Bohrloch IM-18-106: 10,70 g/t Gold über 15,95 m
• Bohrloch IM-18-108: 3.780 g/t Gold über 0,70 m
• Bohrloch IM-18-113: 11,83 g/t Gold über 17,50 m
• Bohrloch IM-18-118: 34,94 g/t Gold über 4,30 m
Quelle :
https://www.minenportal.de/artikel.php?sid=40040
Antwort auf Beitrag Nr.: 58.524.156 von senna7 am 24.08.18 09:32:16Ja, ließt sich auch schön
Nur wann gibts nen neuen NI?
Und wann kommt der nächste Quartalsbericht?
Nur wann gibts nen neuen NI?
Und wann kommt der nächste Quartalsbericht?
Der User Lithomon auf Stockhouse schrieb gestern Folgendes:
"...The Geology is essentially complete, for now. It's conclusive...each successive drill program for the past 18 months or so illustrating compelling highly lucrative Gold grades even at $1150 or $1175 price of gold.
Next, what is needed is an effective operational plan to transition from strong economic geology to lucrative profitable "ore" processing and bullion production...."
Read more at http://www.stockhouse.com/companies/bullboard#0AjQesWykx9BoL…
Also: Entweder kommt bald ein durchdachter Minenplan oder bei den vielen guten, bis sehr guten Bohrlöchern ein exorbitantes Übernahmeangebot....
ohhh so langsam ist nachkaufen angesagt ,leider habe ich auch nicht beim hoch verkauft.
im augenblick ist alles was mit gold und silber zu tun hat tot, in 2 jahren zahlen sie wieder 5 euro dafür
die masse ändert sich nie!
im augenblick ist alles was mit gold und silber zu tun hat tot, in 2 jahren zahlen sie wieder 5 euro dafür
die masse ändert sich nie!
letzte Woche noch wurden noch 0,36 (can$) Order nicht ausgeführt - diese Woche wird es wohl klappen... man kann eigentlich nur nachkaufen, wenns bei Buchverlusten bleiben soll - good times will come.
TORONTO, 06. September 2018 (GLOBE NEWSWIRE) -- Barkerville Gold Mines Ltd. (TSXV:BGM) ("Barkerville" oder die "Gesellschaft") gibt heute bekannt, dass sie einen zweiten geänderten und angepassten Lizenzkaufvertrag (der "Lizenzkaufvertrag") mit Osisko Gold Royalties Ltd ("Osisko") abgeschlossen hat, nach dem Osisko von Barkerville eine 1,75%ige Netto-Schmelzerendite ("NSR") auf das Cariboo-Eigentum (das "Eigentum") für den Gesamtkaufpreis von CAD$ 20 Mio. in sofort verfügbaren Mitteln (die "Royalty Transaction") erwerben wird.
Vom Kaufpreis, der bei Abschluss zu zahlen ist, werden CAD$2.000.000.000 von Barkerville in einem gesonderten Sperrkonto aufbewahrt und stehen Barkerville erst nach Erfüllung bestimmter aufschiebender Bedingungen (die "Restricted Funds") zur Verfügung. Zu diesen aufschiebenden Bedingungen gehört die Lieferung bestimmter Verzichtserklärungen und Zustimmungen von Dritten im Zusammenhang mit der Lizenzgeschäfte an Osisko (die "Vorrangigen Bedingungen").
Gemäß den Bedingungen des Lizenzerwerbsvertrags hat die Gesellschaft auch die Option, Osisko eine zusätzliche 1%ige NSR auf dem Grundstück (die "Optionslizenzgebühr") gegen eine zusätzliche Barabfindung von CAD$13 Mio. zu gewähren, und zwar zu jedem Zeitpunkt zwischen dem Vollzug der Lizenzgeschäfte und dem 31. Dezember 2018 (die "Lizenzoptionsperiode"). Um die Optionslizenz zu gewähren und die zusätzliche Gegenleistung zu erhalten, muss Barkerville die Bedingungen, die der Freigabe der gebundenen Fonds vorausgehen, erfolgreich erfüllt haben.
Für den Fall, dass (i) die Gesellschaft einen Kontrollwechsel während des Lizenzoptions-Zeitraums ankündigt oder (ii) Osisko während des Lizenzoptions-Zeitraums an einer Eigenkapitalfinanzierung der Gesellschaft beteiligt ist, wenn die Optionslizenz nicht ausgeübt wird, hat Osisko das Recht, die Optionslizenz zu erwerben.
Im Rahmen der Lizenztransaktion wird Barkerville Osisko 10.000.000.000 Stammaktien-Kaufgarantien der Gesellschaft (die "Warrants") gewähren. Die Optionsscheine sind für einen Zeitraum von 36 Monaten nach Abschluss der Lizenztransaktion in Stammaktien der Gesellschaft (die "Stammaktien") zu einem Ausübungspreis von CAD$ 0,75 pro Stammaktien umtauschbar. Alle im Rahmen der Lizenzgeschäfte ausgegebenen Wertpapiere unterliegen einer Haltefrist von vier Monaten und einem Tag ab dem Datum des Abschlusses.
Der Bruttoerlös aus der Lizenztransaktion wird von der Gesellschaft zur Finanzierung von Explorationen und Studien im Zusammenhang mit dem Grundstück und für allgemeine Unternehmenszwecke verwendet. Die Lizenztransaktion steht noch unter dem Vorbehalt der endgültigen Genehmigung durch die TSX Venture Exchange.
sind natürlich 2 Mio die im Sperrkonto landen... Sorry (Quelle: Stockhouse)
kommt nun die Wende ???
auf stockhouse schrieb der Nutzer chiliyballs folgendes... es ging darum das einer meinte er hätte etwas von einer Übernahme bei 1,39 Can gehört:
Dumme Scheiß-Mathematik Mathematik würde sagen, dass Insider dem Unternehmen einen gewissen Wert gegeben haben. Wenn die 1,75% NSR für Osisko 20 Millionen Dollar wert ist, dann wären 100% NSR etwa 1,1 Milliarden Dollar vielleicht etwas höher, wenn man den höheren Wert für die zusätzlichen 1% NSR von 13 Millionen Dollar berücksichtigt. Wenn du glaubst, dass dumme Scheiß-Mathematik dann der Aktienkurs $2.40/Aktie basierend auf 450MM Aktien sein sollte.
Da ich den Überblick über die Gesamtzahl der Aktien verloren habe, kann ich sagen, dass es mehr als 450 Millionen gibt und würde den Aktienkurs auf 2,20 Dollar setzen.
Daher sind $1,39 nur ein niedriger Startpunkt und alles, was niedriger ist, ist ein blutiger Diebstahl.
Halten Sie Ihr Pulver trocken.... das nimmt gerade erst Gestalt an. Diese Bewertungen von Osisko und BGM basieren auf dem, was sie heute wissen. Wenn sie Unzen hinzufügen und eine echte Mühle bauen und eine verdammte Lizenz erhalten, wird der Wert steigen.
Für diejenigen, die auf einen Buy-Out hoffen.... ist in der Regel eine 2/3-Mehrheit der für den Abschluss des Verkaufs erforderlichen Aktien erforderlich, und die Insider halten mindestens so viel.
Übersetzt mit www.DeepL.com/Translator
Antwort auf Beitrag Nr.: 58.648.599 von transport am 08.09.18 09:29:26
Da ist einfach abwarten angesagt...
Chillyballs
die Rechnung auf Stockhouse ist natürlich Käse. Da BGM faktisch OR gehört, können die das drehen wie sie möchten. Was BGM wirklich wert ist, kann man nicht abschätzen. Der aktuelle Kurs ist aber definitiv zu günstig. Sommerloch (fehlende Käufer), dümpelnder Goldpreis und ganz gewiss auch Manipulation haben den Aktienkurs dahin gebracht.Da ist einfach abwarten angesagt...
"...Die Goldminen von Barkerville berichten über positive Ergebnisse aus dem ersten Testbergbau von 80.000 Tonnen an der Bonanza-Leiste, bessere Minenqualitäten und eine solide Mühlenleistung.
Minengehalte von 7,05 g/t im Vergleich zum Plan von 6,5 g/t positiv.
Werkserholung mit 91,6% auf Kurs
Sowohl der Minen- als auch der Mühlendurchsatz übersteigen die anfänglichen Zielwerte.
TORONTO, 11. September 2018 (GLOBE NEWSWIRE) -- Barkerville Gold Mines Ltd. (TSXV: BGM) (das "Unternehmen" oder "Barkerville") freut sich, positive Ergebnisse aus seinem Testbergwerk in Bonanza Ledge bekannt zu geben. Die Bonanza Ledge-Mine in Barkerville hat es dem Unternehmen ermöglicht, die Abbauverfahren zu bewerten, die zu erwartenden Bodenverhältnisse in verschiedenen lithologischen Einheiten zu verstehen, lokale Mitarbeiter auszubilden und einen Cashflow zu generieren, um einige Explorationsausgaben auszugleichen. Alle gesammelten Daten werden die Robustheit der Machbarkeitsstudie des Unternehmens, die 2019 veröffentlicht wird, weiter erhöhen.
Seit Beginn des Bonanza Ledge-Projekts wurden ca. 80.000 t mit Langlochmethoden auf zwei aktiven Ebenen gewonnen. Die bisher abgebauten Mining-Blöcke liefern einen besseren Gehalt als erwartet mit einem Durchschnittsgehalt von 7,05 g/t im Vergleich zu den geplanten 6,5 g/t und die Verdünnung liegt mit den prognostizierten 12% auf Kurs. Zementierte Gesteinsschüttung wurde als Hinterfüllung verwendet. Bei der Entwicklung wurden konventionelle Bohr- und Sprengverfahren sowie ein Straßenschild (Continuous Miner) eingesetzt. Die erprobten Entwicklungsmethoden werden sich positiv auf die wirtschaftliche Entwicklung des größeren Projekts am Cow and Island Mountain auswirken; in den letzten 5 Monaten des Betriebs wurden wesentliche Verbesserungen in Bezug auf Leistung und Kosten erzielt. In den letzten Monaten wurden erhebliche Einsparungen bei den Betriebskosten erzielt, wodurch die anfänglichen CAD-Betriebskosten von 300 $/Tonne auf 190 $/Tonne CAD im letzten Monat reduziert wurden.
Chris Lodder sagte: "Wir sind sehr zufrieden mit dem Fortschritt der Mine und der Mühle und werden uns mit unserem Projektteam täglich weiter verbessern. Die Bonanza Ledge Mine beweist die Durchführbarkeit unserer Vision für das Cariboo-Projekt und das Wachstumspotenzial, um ein bedeutender Goldproduzent in British Columbia zu werden."
Signifikante Auswirkungen
Seit Beginn des Bonanza Ledge Projekts wurden keine Unfälle mit Ausfallzeiten registriert.
Die gesamte Bergbauinfrastruktur (Belüftung, Pumpen, Elektrizität) und die Erschließung (über 1.000 m) sind abgeschlossen, und ein lokales Bergbauteam ist vorhanden.
Der durchschnittliche Kopfgehalt von 7,05 g/t war höher als erwartet 6,5 g/t.
Die Minenproduktion konnte bis zu 2000 tpd erreichen, die Mühlenproduktion bis zu 800 tpd.
Bis heute wurden über 70.000 Tonnen Erz abgetragen.
Die gemahlene Verwertung beträgt 91,6% gegenüber den erwarteten 92% und arbeitet derzeit an weiteren Verbesserungen, einschließlich der Wiederinbetriebnahme eines Schwerkraftkreislaufs.
Bis heute wurden über 12.200 Unzen produziert..."
Übersetzt mit www.DeepL.com/Translator
https://web.tmxmoney.com/article.php?newsid=5504524788420415…
Antwort auf Beitrag Nr.: 58.674.027 von iwanowski am 11.09.18 20:08:42Das hört sich nicht schlecht an.
Ich habe meinen Bestand zu 0,24/ 0,25 verdreifacht und meinen Mischkurs deutlich gesenkt. Leider habe ich nicht beim oder Nahe am Top verkauft. Wer jetzt neu einsteigt, für den ist das hier sicher zu 0,28 - 0,30 Euro ein sehr attraktives Invest mit gutem Chance/ Risiko Verhältnis.
Aus meiner Sicht ist BGM viel zu günstig derzeit.
Sollte es nochmal einen Dip Richtung 0,20 geben werde ich nochmal nachlegen.
Zeit, um das Tippspiel wieder aufleben zu lassen??
Antwort auf Beitrag Nr.: 58.698.528 von iwanowski am 14.09.18 10:47:57Wegen dem Übernahmegerücht?
Also damit rechne ich eigentlich weniger. Im Übrigen wäre ich mit einem Angebot von 1 Eur bzw. die im parallethread genannten 1,3 CAD zufrieden. Ich bin schon lang dabei (seeeehr lang) und hab "erfolgreich" alle Möglichkeiten eines guten Verkaufs verschlafen.
Also damit rechne ich eigentlich weniger. Im Übrigen wäre ich mit einem Angebot von 1 Eur bzw. die im parallethread genannten 1,3 CAD zufrieden. Ich bin schon lang dabei (seeeehr lang) und hab "erfolgreich" alle Möglichkeiten eines guten Verkaufs verschlafen.
Antwort auf Beitrag Nr.: 58.699.092 von rpm8200 am 14.09.18 11:39:27... was nicht heißen soll, dass wie ein Vorredner schon meinte auch ganz andere Kurse möglich sind. Im richtigen Umfeld und wenn die Bude läuft (ggf. mit besserer Mühle/ Anlage)... Sky is the limit. Der Boden ist allem Anschein nach gut und die Arbeiten an der Mine gehen auch gut von Statten, da bewegt sich was. Wenn es nicht einen EM Crash gibt (wüsst grad nicht woher - im Angesicht dessen, was uns weltpolitisch um die Ohren pfeift, wundere ich mich ohnehin, dass EM so günstig sind), dann sehe ich auch über diesen Winter schon deutlich bessere Kurse.
Die saure-Gurken-Zeit für EM (über die Sommermonate weg) ist bald vorbei...
Die saure-Gurken-Zeit für EM (über die Sommermonate weg) ist bald vorbei...
Bei den ganzen M&As die momentan im Goldsektor getätigt werden, wird unsere Barkerville auch bald wieder in den Fokus der Bigs rücken. Gruß Lenny
Zakatooomm... nette Bohrergebnisse frisch aus dem Drucker:
"...TORONTO, 27. September 2018 /CNW/ - Barkerville Gold Mines Ltd. (TSXV: BGM) (das "Unternehmen" oder "Barkerville") freut sich, die Bohrergebnisse des laufenden Cow Mountain Explorations- und Kategorieumwandlungsprogramms 2018 auf dem Flaggschiff Cariboo Gold Project des Unternehmens bekannt zu geben. Die Bohrergebnisse zeigen die Kontinuität der hochgradigen Goldmineralisierung in den Venenkorridoren. Das Unternehmen untersucht und beschreibt derzeit hochgradige Venenkorridore mit vier Diamantbohrern am Cow Mountain.
Barkerville Gold Mines Ltd. (CNW Group/Barkerville Gold Mines Ltd.)
Ausgewählte Highlights rund ums Bohren:
CM-18-005: 28,98 g/t Au über 1,90 Meter (sichtbares Gold wurde beobachtet)
CM-18-006: 12,47 g/t Au auf 5,35 Metern Höhe
CM-18-007: 30,62 g/t Au über 1,80 Meter (sichtbares Gold wurde beobachtet)
CM-18-007: 76,90 g/t Au auf 0,70 Meter Höhe
CM-18-010: 10,70 g/t Au auf 5,85 Meter Höhe
CM-18-012: 24,69 g/t Au über 3,15 Meter (sichtbares Gold wurde beobachtet)
CM-18-013: 23,18 g/t Au auf 3,70 Meter Höhe
CM-18-017: 20,41 g/t Au auf 2,95 Meter Höhe
CM-18-018: 109,05 g/t Au über 1,20 Meter (sichtbares Gold wurde beobachtet)
CM-18-024: 26,33 g/t Au auf 4,00 Metern Höhe
CM-18-029: 160,50 g/t Au über 0,85 Meter (sichtbares Gold wurde beobachtet)
CM-18-029: 39,81 g/t Au auf 2,10 Metern Höhe
CM-18-039: 377,00 g/t Au auf 0,50 Meter Höhe
CM-18-040: 66,40 g/t Au auf 1,30 Meter Höhe
CM-18-043: 19,73 g/t Au auf 3,05 Metern Höhe
CM-18-045: 13,07 g/t Au auf 5,05 Metern Höhe
CM-18-049: 24,40 g/t Au auf 2,20 Meter Höhe
Detaillierte Bohrergebnisse sind in der folgenden Tabelle dargestellt. Am Ende dieser Mitteilung wird eine Lageplankarte und ein Längsschnitt für das Bohrloch präsentiert. Das 3D-Lagerstättenmodell Cow Mountain mit Assay-Highlights befindet sich auf der Website des Unternehmens..."
Übersetzt mit www.DeepL.com/Translator
https://web.tmxmoney.com/article.php?newsid=7618146683386117…" target="_blank" rel="nofollow ugc noopener">
https://web.tmxmoney.com/article.php?newsid=7618146683386117…
In der ersten Stunde gingen bisher 7,3 Millionen Aktien !!! über den Tisch....
Leider nur hoher Umsatz - der Anstieg fehlt
Antwort auf Beitrag Nr.: 58.815.392 von hundadoption am 27.09.18 17:07:468% Plus bei -1% im Gold...find`ich nicht soooo schlecht!
Gruß
Lenny
Gruß
Lenny
Antwort auf Beitrag Nr.: 58.815.392 von hundadoption am 27.09.18 17:07:466,7 Mio. waren Hayworth Securities an Hayworth Securities.. was uns das immer sagen soll/muß...
Antwort auf Beitrag Nr.: 58.815.536 von Lennypenny am 27.09.18 17:19:56So gesehen -- ist der Anstieg positiv zu sehen.
Aber nicht wirklich ein Bruch nach oben.
Aber nicht wirklich ein Bruch nach oben.
COW MOUNTAIN DRILLING INTERSECTS HIGH GRADE GOLD MINERALIZATION
10.70 G/T GOLD OVER 5.85 METERS AND 26.33 G/T GOLD OVER 4.00 METERS
...
http://barkervillegold.com/2018/09/cow-mountain-drilling-int…" target="_blank" rel="nofollow ugc noopener">http://barkervillegold.com/2018/09/cow-mountain-drilling-int…
Freundliche Grüße
supernova
10.70 G/T GOLD OVER 5.85 METERS AND 26.33 G/T GOLD OVER 4.00 METERS
...
http://barkervillegold.com/2018/09/cow-mountain-drilling-int…" target="_blank" rel="nofollow ugc noopener">http://barkervillegold.com/2018/09/cow-mountain-drilling-int…
Freundliche Grüße
supernova
...sind alle Goldies blind, oder warum fliegt der Deckel hier nicht? Bohrergebnisse wieder gut,...aber keinen interessierts.
Gruß
Lenny
Gruß
Lenny
Gold steigt um 1,5% und Barkerville dümpelt weiter vor sich hin So ganz gefällt mir das nicht, zumal es bei anderen Minern heute ganz anders aussieht...nämlich dunkelgrün!
Was mag dahinter stecken?
Gruß
Lenny
 So ganz gefällt mir das nicht, zumal es bei anderen Minern heute ganz anders aussieht...nämlich dunkelgrün!
Was mag dahinter stecken?
Gruß
Lenny
Antwort auf Beitrag Nr.: 58.854.378 von Lennypenny am 02.10.18 17:12:07Irgendwie läuft es aktuell bei keiner Goldmine so richtig rund die Minen sind ziehmlich unterbewerter was hat dir Firma falsch gemacht?
Antwort auf Beitrag Nr.: 59.122.094 von freddy1989 am 02.11.18 11:23:42Was auffällt ist der Performance-Unterschied zwischen kanadischen und australischen EM Minern.
Ich weiß nicht, in wie weit die Beteiligung von Osisko bei Barkerville mit reinspielt. Osisko hat ja nicht den besten Ruf in der Mining Gilde. Ich stecke da aber zu wenig im Thema drin und will mich nicht all zu weit aus dem Fenster hängen. Ich habe meine Position jedenfalls halbiert.
Gruß
Lenny
Ich weiß nicht, in wie weit die Beteiligung von Osisko bei Barkerville mit reinspielt. Osisko hat ja nicht den besten Ruf in der Mining Gilde. Ich stecke da aber zu wenig im Thema drin und will mich nicht all zu weit aus dem Fenster hängen. Ich habe meine Position jedenfalls halbiert.
Gruß
Lenny
November 6, 2018
Cow Mountain Drilling Extends High Grade Gold Mineralization Down Dip to 400 Meters – HIGH-GRADE INTERCEPTS INCLUDE 11.84 G/T GOLD OVER 7.50 METERS, 104 G/T GOLD OVER 0.50 M, 200 G/T GOLDOVER 0.50 M, 101.5 G/T GOLD OVER 0.95 M and 346 G/T GOLD OVER 0.50 METERS
https://www.newswire.ca/news-releases/cow-mountain-drilling-…
Freundliche Grüße
supernova
Neue Barkerville Video-Präsentation: http://www.commodity-tv.net/c/mid,39138,Osisko_Gala_Dinner_N…
“BGM is not just building a mine, we’re developing a mining district.”
Sean Roosen
Chairman, Barkerville Gold Mines Ltd.
https://www.newswire.ca/news-releases/barkerville-gold-inter…
Barkerville Gold Intersects 24.06 g/t Gold Over 6.45 Meters and Extends Vein Corridors at Depth
Freundliche Grüße
supernova
Sean Roosen
Chairman, Barkerville Gold Mines Ltd.
https://www.newswire.ca/news-releases/barkerville-gold-inter…
Barkerville Gold Intersects 24.06 g/t Gold Over 6.45 Meters and Extends Vein Corridors at Depth
Freundliche Grüße
supernova
Es hebt zwar nicht die Stimmung/Kurs, ist dennoch eine relevante Unternehmensnachricht:
Quelle: www.goldseiten.de / 18.12.2018" target="_blank" rel="nofollow ugc noopener">https://www.goldseiten.de/artikel/399464--Barkerville-Comple…" target="_blank" rel="nofollow ugc noopener">https://www.goldseiten.de/artikel/399464--Barkerville-Comple…
Quelle: www.goldseiten.de / 18.12.2018" target="_blank" rel="nofollow ugc noopener">https://www.goldseiten.de/artikel/399464--Barkerville-Comple…" target="_blank" rel="nofollow ugc noopener">https://www.goldseiten.de/artikel/399464--Barkerville-Comple…
ich bin am überlegen nachzulegen
Da warte ich noch mit bis das Handelsvolumen etwas anzieht.
Dass das solch ein Langfrist-Investment wird habe ich nicht auf dem Schirm gehabt und ich bin schon länger drin.
Gut Ding will hier hoffentlich nur Weile haben.
Dass das solch ein Langfrist-Investment wird habe ich nicht auf dem Schirm gehabt und ich bin schon länger drin.
Gut Ding will hier hoffentlich nur Weile haben.
Antwort auf Beitrag Nr.: 59.477.775 von senna7 am 20.12.18 11:01:11
...meine Sonderdividende von Chalice habe ich eben zum Nachkauf bei Barkerville genutzt
Gruß
Lenny
Zitat von senna7: ich bin am überlegen nachzulegen
...meine Sonderdividende von Chalice habe ich eben zum Nachkauf bei Barkerville genutzt
Gruß
Lenny
Antwort auf Beitrag Nr.: 59.477.775 von senna7 am 20.12.18 11:01:11
wären schon 20%
Trump schießt gegen die Fed. Stößt er damit eine neue Gold Hausse an? Gelitten haben wir genug. Einfaches Einfügen von wallstreetONLINE Charts: So funktionierts.
guter Kaufzeitpunkt nä @DOSTO
lang zu
lang zu
Antwort auf Beitrag Nr.: 59.509.708 von senna7 am 26.12.18 17:59:51
wieder dabei
Nachdem ich hier schon mal dabei war, und zum Glück noch mit Gewinn verkaufen konnte, bin ich nun auch wieder dabei. Habe die Aktie nie aus den Augen verloren und ich denke, 2019 könnte ein richtig gutes Jahr für Barkerville werden. Dazu muss natürlich auch der Goldpreis etwas mitspielen. Ich bin mir natürlich bewusst, dass ich etwas früher einsteigen hätte sollen. Bin aber trotzdem positiv eingestellt. Wünsche allen ein gutes Barkerville Gold Mines 2019 Jahr!
guter ZUG !!!
https://www.newswire.ca/news-releases/barkerville-gold-inter…
Barkerville Gold Intersects 9.85 g/t Gold Over 10.40 Meters and 8.96 g/t Gold Over 8.60 Meters
Freundliche Grüße
supernova
Barkerville Gold Intersects 9.85 g/t Gold Over 10.40 Meters and 8.96 g/t Gold Over 8.60 Meters
Freundliche Grüße
supernova
Antwort auf Beitrag Nr.: 59.602.145 von supernova1712 am 10.01.19 15:12:45Das Ganze nochmal auf deutsch...:
"...Barkerville veröffentlicht Bohrergebnisse des Cariboo-Projekts
Barkerville Gold Mines Ltd. veröffentlichte gestern neue Bohrergebnisse der im Jahr 2018 stattgefundenen Bohrungen. Diese wurden im Rahmen eines Explorationsprogramms in der Cow-Mountain-Liegenschaft und innerhalb des unternehmenseigenen Cariboo-Goldprojektes durchgeführt. Während der Durchführung der Bohrungen wurde insgesamt 63.970 und mit 231 Löchern gebohrt.
Höhepunkte der Bohrungen umfassten unter anderem:
Bohrloch CM-18-159: 169,50 g/t Gold über 0,50 Meter
Bohrloch CM-18-178: 73,70 g/t Gold über 0,70 Meter
Bohrloch CM-18-172: 35,32 g/t Gold über 3,50 Meter; darin 180,50 g/t Gold über 0,55 Meter..."
https://www.goldseiten.de/artikel/401012--Barkerville-veroef…
+10% bei 4-fachem Tagesvolumen. Geht da was:-)? Übernahme durch Osisko nachdem heute Goldcorp übernommen wurde?
Antwort auf Beitrag Nr.: 59.630.636 von SmallCapTrade am 14.01.19 22:29:39Ich hoffe doch nicht, nachdem ich vor kurzen hier erst meine erste kleine Position aufbauen konnte. Denke Gold wird kurzfristig konsolidieren und das wird auch Barkerville nach unten mitziehen. Über die 0,30 EUR wird es vermutlich erst mal (nachhaltig!) nicht gehen..
wie kommstdu drauf das Gold konsolidiert ???
Gold holt nun erstmal LUFT für die 1360
Gold holt nun erstmal LUFT für die 1360
Antwort auf Beitrag Nr.: 59.632.607 von senna7 am 15.01.19 09:57:40
Warten wir heute mal die Brexitsitzung ab
Konsolidieren
Konsolidierung sehe ich bei Gold schon seit einigen Tagen. Halt auf erhöhten Niveau. Bin kein Chartguru, traue mir aber schon zu zusagen, bei normalem Umfeld stoßen wir bald durch die 1300. Warten wir heute mal die Brexitsitzung ab
Antwort auf Beitrag Nr.: 59.632.709 von lale93 am 15.01.19 10:10:02Also ich sehe das genau anders herum. Bisher ist man ja gar nicht an die 1300 Dollar ran gelaufen, sondern es drehte immer kurz nach 1295 Dollar. Ich gehe dementsprechend erst mal davon aus, dass man die nächsten Tage den psychologischen Widerstand bei der 1300 Marke angeht und dann von dort aus, auch wenn kurzfristig drüber, erst einmal zurück fällt.
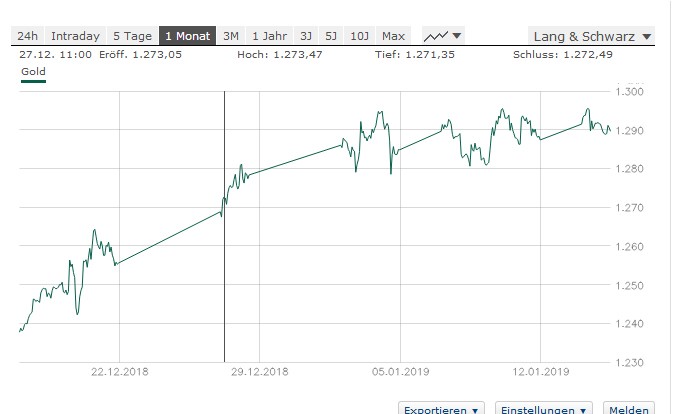
Wie weit ist dann die Frage, aber die erste Unterstützung bei 1280 wird denke nicht halten und ein Niveau von 1220/1200 angesteuert. Mögliche Indikatoren dafür: weiteres Einlenken beim Zollstreit und Einigung im Kongress (Beendigung des Shut-Down).
Sollte es anders kommen, wäre es natürlich top. Doch die Shortys werden sich nicht so leicht geschlagen geben. Die Aussage mit Platz bis 1360 Dollar versteh ich nicht bzw. sehe ich den Widerstand bei 1300 erst mal als entsprechende Hürde...
Also ich sehe schon, dass Gold bei einem Ausbruch über 1300 Platz bis 1360 hätte. Also nicht falsch verstehen ;-)
Wiederstand klar bei 1295 -1304 ( gelbe Zone ) ...darum gehts ...sind aber "NUR ca 10 Punkte von jetzt aus ...
ABER !!! wenn diese Marke fällt kann es sehr schnell Richtung 1350-1360 gehen , da dann die Shorties in Bedrägnis kommen und sich eindecken müssen ....
der Markt wird esd uns zeigen PEACE ...

ABER !!! wenn diese Marke fällt kann es sehr schnell Richtung 1350-1360 gehen , da dann die Shorties in Bedrägnis kommen und sich eindecken müssen ....
der Markt wird esd uns zeigen
PEACE ...
mmmh - die bezahlen ihre Führungskräfte nicht klein-klein - Alter Schwede da kann man ja Abfindungen zum Hobby erklären:
Gold Summary for Jan. 17, 20192019-01-17 19:51 ET - Market Summaryby Stockwatch Business Reporter
Chris Lodder's Barkerville Gold Mines Ltd. (BGM), down two cents to 43 cents on 161,000 shares, plans another major drill program at its Cariboo gold project in south-central British Columbia. The company completed 123,000 metres of drilling last year and plans nearly as much again this year to expand and upgrade the existing resource. Drilling over the past few years has yielded a significant resource at Cariboo, with 8.1 million tonnes measured and indicated at 6.1 grams of gold per tonne and another 12.7 million tonnes inferred at 5.2 grams per tonne, for a combined 3.75 million ounces. (Over two million of the ounces reside in the Shaft zone.) The company plans 50,000 metres of drilling initially, which will include infill drilling of high-grade vein corridors with greater than six grams of gold per tonne, with the aim of upgrading inferred resources in those areas to higher classifications. As well, Barkerville will test the true depth potential of the high-grade vein corridors at the Shaft, Cow Mountain and Mosquito Creek zones, using 50-metre stepout holes. Following the first phase of drilling, a second program will kick in, with another 40,000 metres planned. The Oakville-based Mr. Lodder, Barkerville's $425,000-per-year president and CEO since mid-2016, has shown staying power in the role -- a welcome relief from what Barkerville experienced over the previous few years. Although his predecessors collected less salary, they made up for it through big termination payments. Tom Obradovich had been collecting just $300,000 per year when he parted ways with Barkerville in 2016, and he apparently got $600,000 as a termination benefit. Frank Callaghan had been earning $240,000 until he left in 2014, just ahead of regulatory scrutiny. He continued to draw his salary for the next two years as a termination benefit.
Antwort auf Beitrag Nr.: 59.730.054 von transport am 28.01.19 19:10:13Naja ... der Erfolg eines Unternehmens hängt in ganz entscheidendem Mass von den "Machern" ab .
Wo Osisko dahintersteht und sein Kapital investiert, dort ist die creme de la creme der Branche am Werk , darunter echte Koryphäen , die sich zuvor schon bei anderen Projekten und Unternehmen, in die Osisko investiert hat und bei anderen Grossen der Branche verdient gemacht haben . Solche top Leute gibts wie anderswo auch nur zu "konkurrenzfähigen Preisen" , denn die sind in der Branche heiis gefragt .
Ausserdem ist deren rund-um-die Uhr-Job unter den Bedingungen eines Explorationsunternehmens mit weitgefächerten Projekten nicht vergleichbar mit der Tätigkeit eines Industriemanagers im Ledersessel von BMW oder Bayer ...
Antwort auf Beitrag Nr.: 59.635.784 von senna7 am 15.01.19 15:47:55Senna, bist Du noch dabei, oder hast schon geschmissen. Ich halte die Position und überlege nochmals zu verbilligen. Hier könnte schon eine Übernahme kommen.
Bist Du auch bei MTA dabei - ich hatte Dir, die oftmals empfohlen.
Ich weiss der Fantomas 96 ist dabei.
lg
hbc002
Bist Du auch bei MTA dabei - ich hatte Dir, die oftmals empfohlen.
Ich weiss der Fantomas 96 ist dabei.
lg
hbc002
Klar bei beiden seit Jahren fest dabei..und geb auch JETZT
bestimmt nichts her..
bestimmt nichts her..
MTA? Welcher Miner idt das? Gruß Lenny
Antwort auf Beitrag Nr.: 59.755.485 von Lennypenny am 31.01.19 12:22:47
https://www.wallstreet-online.de/diskussion/1171634-4381-439…" target="_blank" rel="nofollow ugc noopener">
https://www.wallstreet-online.de/diskussion/1171634-4381-439…
Zitat von Lennypenny: MTA? Welcher Miner idt das? Gruß Lenny
https://www.wallstreet-online.de/diskussion/1171634-4381-439…" target="_blank" rel="nofollow ugc noopener">
https://www.wallstreet-online.de/diskussion/1171634-4381-439…
ich verlinke das nochmal ...
https://www.newswire.ca/news-releases/barkerville-gold-inter…
bei solchen Löchern darf man das
Selected Drilling Highlights:
IM-18-162: 14.55 g/t Au over 3.65 meters
IM-18-164: 34.90 g/t Au over 1.45 meters
IM-18-169: 9.72 g/t Au over 14.40 meters
IM-18-173: 24.97 g/t Au over 2.50 meters
IM-18-174: 9.01 g/t Au over 5.50 meters
IM-18-176: 32.44 g/t Au over 3.00 meters including 97.80 g/t Au over 0.50 meter
IM-18-176: 105.0 g/t Au over 0.65 meter
IM-MET-18-001: 63.63 g/t Au over 1.25 meters
IM-MET-18-001: 142.5 g/t Au over 0.50 meter
IM-MET-18-002: 7.75 g/t Au over 46.0 meters
IM-MET-18-003: 42.10 g/t Au over 1.20 meters
IM-MET-18-003: 110.5 g/t Au over 1.00 meter
IM-MET-18-004: 34.61 g/t Au over 5.00 meters including 137.5 g/t Au over 0.85 meter
CM-MET-18-001: 5.78 g/t Au over 8.25 meters
Antwort auf Beitrag Nr.: 59.921.597 von senna7 am 20.02.19 15:23:59Na, wenn der Kurs heute nicht anspringt, wann dann....
das stimmt ...
ich muß sagen ich bin auch etwas entäuscht über den aktuellen Kurs bei BGM
und hoffe das nun langsam die Trendwende kommt ....
grob gezeichnet

ich muß sagen ich bin auch etwas entäuscht über den aktuellen Kurs bei BGM
und hoffe das nun langsam die Trendwende kommt ....
grob gezeichnet
Antwort auf Beitrag Nr.: 59.921.753 von senna7 am 20.02.19 15:33:41...selbiger Chart mit Widerstandslinie bei 0,45-0,46 Can$ ! Wenn wir da durch sind (könnte heute klappen), wird auch Barkerville besser laufen.
Gruß
Lenny
Gruß
Lenny
so nä ???

wenigstens gute Umsätze heute bei steigenden Kursen
Antwort auf Beitrag Nr.: 59.923.031 von senna7 am 20.02.19 17:05:50...Jo, wie der Hamburger so schön sagt! Dat meen ich!
Gruß und Danke,
Lenny
Gruß und Danke,
Lenny
Antwort auf Beitrag Nr.: 59.923.031 von senna7 am 20.02.19 17:05:50
Auf jeden Fall war Zeit genug sich schon bei steigenden Goldpreis noch zu positionieren. Auch nicht schlecht. Die Financings waren halt zu günstig. Die Investoren haben scheinbar noch Altbestände loswerden wollen...
Muss ja mal vorbei sein.
Deine Charts
sind schon richtig so. Würde mich wundern, wenn es nicht so laufen würde.Auf jeden Fall war Zeit genug sich schon bei steigenden Goldpreis noch zu positionieren. Auch nicht schlecht. Die Financings waren halt zu günstig. Die Investoren haben scheinbar noch Altbestände loswerden wollen...
Muss ja mal vorbei sein.
Antwort auf Beitrag Nr.: 59.923.400 von lale93 am 20.02.19 17:31:26
…hat ja auch keiner gesagt, dass die Charts falsch sind! Hoffe, Du hast kein Problem damit, wenn man sich gegenseitig ergänzt
Zitat von lale93: sind schon richtig so. Würde mich wundern, wenn es nicht so laufen würde.
Auf jeden Fall war Zeit genug sich schon bei steigenden Goldpreis noch zu positionieren. Auch nicht schlecht. Die Financings waren halt zu günstig. Die Investoren haben scheinbar noch Altbestände loswerden wollen...
Muss ja mal vorbei sein.
…hat ja auch keiner gesagt, dass die Charts falsch sind! Hoffe, Du hast kein Problem damit, wenn man sich gegenseitig ergänzt
Antwort auf Beitrag Nr.: 59.923.535 von Lennypenny am 20.02.19 17:42:52
sorry,
das war reine Zustimmung
Die 0,45 CAD bzw 0,30 EUR scheinen doch einen bemerkenswerten kurzfristigen Widerstand darzustellen. Klar hängt es hier auch, wie bei allen anderen Minenwerte, mit dem Goldkursniveau zusammen.
Nicht desto trotz läuft die Aktie nicht wirklich mit dem doch positiven Newsflow der vergangenen Monate einher.
Auf was wartet denn hier bitte der Markt?
Nicht desto trotz läuft die Aktie nicht wirklich mit dem doch positiven Newsflow der vergangenen Monate einher.
Auf was wartet denn hier bitte der Markt?
Antwort auf Beitrag Nr.: 59.963.332 von 90BVB09 am 26.02.19 08:59:54
das ist die 1Mio FRAGE !!!
aber an Aktienmärkten gibt es zum Teil Manipulationen der Big Player ...
vielleicht will ja auch nur jemand das der Kurs nicht so schnell steigt ???
vielleicht sammelt ja noch ener seine Kröten zusammen für Einstieg ???
ich persönliche denke das der Explorermarkt bei steigenden Goldpreisen wieder in Mode kommen könnte .... den Explorer , wurden die letzten Jahre an der Börsen so gut wie gar nicht "gespielt "
Zitat von 90BVB09: Auf was wartet denn hier bitte der Markt?
das ist die 1Mio FRAGE !!!
aber an Aktienmärkten gibt es zum Teil Manipulationen der Big Player ...
vielleicht will ja auch nur jemand das der Kurs nicht so schnell steigt ???
vielleicht sammelt ja noch ener seine Kröten zusammen für Einstieg ???
ich persönliche denke das der Explorermarkt bei steigenden Goldpreisen wieder in Mode kommen könnte .... den Explorer , wurden die letzten Jahre an der Börsen so gut wie gar nicht "gespielt "
Antwort auf Beitrag Nr.: 59.965.138 von senna7 am 26.02.19 11:50:57
Der Deckel fliegt auch noch
dann aber gewaltig...
schöner 5 Jahreschart ...
Aus Stockhouse

Aus Stockhouse
sehr gute Bohrergebnisse wie ich finde
Barkerville drills 17.9 m of 19.34 g/t Au at Cariboo
https://www.stockwatch.com/News/Item.aspx?bid=Z-C%3aBGM-2735…
Barkerville drills 17.9 m of 19.34 g/t Au at Cariboo
https://www.stockwatch.com/News/Item.aspx?bid=Z-C%3aBGM-2735…
Antwort auf Beitrag Nr.: 51.736.147 von faultcode am 12.02.16 23:23:50
--> 2019-04 (fully diluted): 548,733,119
--> das ist das, was hier den Kurs auch weiterhin unten halten wird
--> BGM findet einfach nicht genügend neue Resourcen beim derzeitigen Goldpreis, um diese Wahnsinns-Verwässerung für die Bestandsaktionäre aufzufangen
--> und was soll das mit immer noch ~110km Trucking zur QR Mill?!? --> viel zu teuer!
--> irgendwann wird's hier schon losgehen; nachdem die Altaktionäre von Osisko Mining und Co. herausgedrängt wurden
=> aber nur wenn die hier richtig buddeln dürfen und vor Ort eine Mine aufstellen dürfen --> danach sieht es aber gar nicht aus
~3 Jahre später
12.2.2016Zitat von faultcode: Total shares BGM:
- 2015-Q4: 246.192.168
- 2015-Q2: 160.182.883
- ...
- 2013-Q2: 135.305.718
- 2013-Q1: 136.280.828
alte Goldminen-Krankheit, gerade bei BGM...
was soll da noch weiter ausbrechen?
--> 2019-04 (fully diluted): 548,733,119
--> das ist das, was hier den Kurs auch weiterhin unten halten wird
--> BGM findet einfach nicht genügend neue Resourcen beim derzeitigen Goldpreis, um diese Wahnsinns-Verwässerung für die Bestandsaktionäre aufzufangen
--> und was soll das mit immer noch ~110km Trucking zur QR Mill?!?
--> viel zu teuer!--> irgendwann wird's hier schon losgehen; nachdem die Altaktionäre von Osisko Mining und Co. herausgedrängt wurden
=> aber nur wenn die hier richtig buddeln dürfen und vor Ort eine Mine aufstellen dürfen --> danach sieht es aber gar nicht aus
so ich habe heute für 0,31 hier verbilligt und zugegriffen ...
der Kurs steht charttechnisch an einer Haltelinie , ich hoffe & denke das der Kurs nun wieder nach oben dreht

der Kurs steht charttechnisch an einer Haltelinie , ich hoffe & denke das der Kurs nun wieder nach oben dreht
BGM Extends Mineralized Horizon by 2.5 Kilometers
DRILLING INTERSECTS 19.3 G/T OVER 6.3 METERS 47.5 METERS FROM SURFACE
http://crweworld.com/article/news-provided-by-pr-newswire/10…
DRILLING INTERSECTS 19.3 G/T OVER 6.3 METERS 47.5 METERS FROM SURFACE
http://crweworld.com/article/news-provided-by-pr-newswire/10…
https://steelguru.com/mining/barkerville-gold-announces-new-…
Select Drilling Highlights:
• BM-19-003: 7.88 g/t Au over 2.00 meters including 25.5 g/t Au over 0.60 meters
• BM-19-003:102.0 g/t Au over 0.50 meters
• BM-19-004: 5.71 g/t Au over 2.60 meters including 22.8 g/t Au over 0.60 meters
• BM-19-005:19.30 g/t Au over 6.30 meters including 69.40 g/t Au over 0.50 meter
• BM-19-009: 9.86 g/t Au over 2.45 meters including 21.9 g/t Au over 1.0 meter
• BM-19-011: 54.6 g/t Au over 0.5 meters
• BM-19-013:12.23 g/t Au over 2.80 meters including 33.60 g/t Au over 0.50 meter
• BM-19-013: 40.10 g/t Au over 0.80 meter
sind ein paar schöne Löcher ...
irgendwann wird da dann auc mal abgebaut , egal vom wem ... und darauf warte ich
irgendwann wird da dann auc mal abgebaut , egal vom wem ... und darauf warte ich
https://www.newswire.ca/news-releases/bgm-intersects-10-76-g…
BGM Intersects 10.76 g/t Gold Over 20.0 Meters in Deep Exploration on Island Mountain
May 02, 2019, 07:00 ET
...
Freundliche Grüße
supernova
May 02, 2019, 07:00 ET
BGM Intersects 10.76 g/t Gold Over 20.0 Meters in Deep Exploration on Island Mountain
May 02, 2019, 07:00 ET
...
Freundliche Grüße
supernova
May 02, 2019, 07:00 ET
wenn nur endlich der Goldpreis mitspielen würde .... aber das wird noch davon bin ich überzeugt ....
Antwort auf Beitrag Nr.: 60.471.092 von senna7 am 02.05.19 13:30:12Meinst du den Goldkurs kurzfristig oder den von vielen erwarteten Ausbruch über die Seitwärtsphase beim Niveau von rund 1400 Dollar?
Wenn man mal die bis dato diesjährige Entwicklung des Goldpreises anschaut, hatte der doch positive Verlauf kaum eine Auswirkung auf Barkerville. Ich hatte sie mir damals als ES größer eingestiegen ist auf die Watch gelegt und eine kleine Miniposition bei 0,24 EUR vor kurzen geholt.
Zum Glück hatte ich mich nicht schon bei ü 1CAD verleiten lassen eine Anfangsposition aufzubauen. Also so richtig beschäftigt hatte ich mich mit der Aktie auch nicht, das war mehr ein Spontankauf.
Faultcode hatte mich mit seinem Beitrag erst mal wieder daran erinnert, dass man nicht blind kaufen sollte. Ein gewisses Grundresearch muss man betreiben. Leider fehlt mir dazu jedoch die Zeit sowie die Expertise. Börse ist für mich eine Art Hobby und ich handle bis auf eine Ausnahme (2010 BVb Aktie all in) auch nur mit kleineren Beträgen gesplittet auf viele Einzelwerte.
Was für Faktoren, bis auf einen Ausbruch beim Gold, sind denn bei Barkerville relevant und für einen Kursausbruch erforderlich? Ist eine Abbaulizenz wirklich so fraglich? Kann hier vielleicht mit ein paar Punkten jemand Licht in meine Dunkle Kugel (Birne ) bringen?
Wenn man mal die bis dato diesjährige Entwicklung des Goldpreises anschaut, hatte der doch positive Verlauf kaum eine Auswirkung auf Barkerville. Ich hatte sie mir damals als ES größer eingestiegen ist auf die Watch gelegt und eine kleine Miniposition bei 0,24 EUR vor kurzen geholt.
Zum Glück hatte ich mich nicht schon bei ü 1CAD verleiten lassen eine Anfangsposition aufzubauen. Also so richtig beschäftigt hatte ich mich mit der Aktie auch nicht, das war mehr ein Spontankauf.
Faultcode hatte mich mit seinem Beitrag erst mal wieder daran erinnert, dass man nicht blind kaufen sollte. Ein gewisses Grundresearch muss man betreiben. Leider fehlt mir dazu jedoch die Zeit sowie die Expertise. Börse ist für mich eine Art Hobby und ich handle bis auf eine Ausnahme (2010 BVb Aktie all in) auch nur mit kleineren Beträgen gesplittet auf viele Einzelwerte.
Was für Faktoren, bis auf einen Ausbruch beim Gold, sind denn bei Barkerville relevant und für einen Kursausbruch erforderlich? Ist eine Abbaulizenz wirklich so fraglich? Kann hier vielleicht mit ein paar Punkten jemand Licht in meine Dunkle Kugel (Birne
) bringen?
Antwort auf Beitrag Nr.: 60.473.363 von 90BVB09 am 02.05.19 17:17:33Bei 0,30 CAD scheint sich ein Boden abzubilden. Zumindest ist die Aktie von dort aus erst mal wieder nach oben abgeprallt...
Antwort auf Beitrag Nr.: 60.471.092 von senna7 am 02.05.19 13:30:12
Finally mit einigen Nachkäufen bleibt die Hoffnung, dass sich der Umschwung nicht nur andeutet
reden wir mittlerweile schon seit über einen Jahr von
Leider ist der Goldpreis ein "träger Dampfer", an dem doch noch so einige ihre speziellen Vorstellungen ausspielen... Finally mit einigen Nachkäufen bleibt die Hoffnung, dass sich der Umschwung nicht nur andeutet
BGM kündigt aktualisierte Untergrundressourcen für das Cariboo Gold-Projekt an
https://mma.prnewswire.com/media/893921/Barkerville_Gold_Min…
https://www.newswire.ca/news-releases/bgm-announces-updated-…
https://mma.prnewswire.com/media/893921/Barkerville_Gold_Min…
https://www.newswire.ca/news-releases/bgm-announces-updated-…
Dieses Bild ist nicht SSL-verschlüsselt: [url]http://cdn.ceo.ca.s3-us-west-2.amazonaws.com/1ef08js-Screenshot%20%286438%29.png
[/url] Situation
mit der PR vom 11. September letzten Jahres dachte man, BGM startet die Produktion. Leider wurde alles eingestellt. Die Testproduktion fließt in die Feasibility Study ein. Das ist schon mal gut. Wie es aussieht, gibt es einige Umweltauflagen. Sollten Ende Q3 durch sein.
Hat jemand einen Termin für die Feasibility Study??
soviel zu den Umweltauflagen aus der MD&A aus 2018 (21.5.19):
Mining operations at Bonanza Ledge, and milling operations at QR Mill, were put on hold in December2018; both locations have been in a Temporary Production Interruption. The Operations team is working through the list of outstanding Inspection Orders and resolving theissues raised by the AMPs(Administrative Monetary Penalty). By the end of the second quarter, BGM should have closed allInspections Orders and have a solution in place for the non-compliances that resulted in the AMPs.A Short-Term Water Management Plan was approved by both MEMPR and MOE and was put in place at QR.Regulators imposed a contingency plan (piping and pumps), extra instrumentation, and extraconsultation costs. The next projects are the Water Treatment Plant at Bonanza Ledge and the start of the Mosquito Creek Tailings closure.By the end of Q3, we believe we will have corrected all inspections orders and will have resolved thecauses of the AMPs. Furthermore, we are expecting a fine (not expected to be material) on the 7 AMP’s related to discharge water quality non-compliant with the MOE permit at Bonanza Ledge.We believe those issueswill beresolved within this year. Regarding the PAG piledisposalat Bonanza Ledge, the Company believespermitting Bonanza Ledge Phase II is thebest strategyto reclaim the PAG pile. BGM has a current obligation to dispose of the PAG pile by September 2019 by back-fillinginto the old pit and to the QR Mill Main Zone Pit. TheBonanza Ledge Phase II permit would grant permission to keep the PAG on-site at Bonanza Ledgeand use it as backfill material for the extracted stopes, withthe implementation of a water treatment, until we complete mining BC Vein or decide to close the Bonanza Ledge site.
So ganz klar ist mir die Strategie nicht. Sieht danach aus, als würde Barkerville sich anschicken, Ende 2019 zu produzieren und parallel die Resource weiter zu vergrößern.
Hat jemand eine Antwort auf die Frage:
Was ist der Unterschied zwischen Resource und Reserve?
Wir gehen hier ggf. einen "echten Deal" entgegen. BGM kann durchaus 10 Mio Unzen groß werden, das wissen auch die Manager und OR. Deshalb investieren sie ja auch fleißig. Wer macht das Rennen und was fällt für uns dabei ab.
Im Moment bleibt es ruhig, kaum Infos von BGM, schon gar nicht zum "Wasserstand" der vorgenannten Baustellen.
Wird da noch günstig gesammelt?
Auch hier kann es sehr schnell nach oben gehen.
Analyst Andrew Mikitchook veranschlagt ein Kursziel von 0,80 CAD
https://www.aktiencheck.de/exklusiv/Artikel-Barkerville_Gold…
https://www.aktiencheck.de/exklusiv/Artikel-Barkerville_Gold…
und die Resource
wächst und gedeiht :-)https://www.stockwatch.com/News/Item.aspx?bid=Z-C%3aBGM-2784…
drilling highlights for vein corridors:
BM-19-022: 6.25 g/t Au over 5.15 metres;
BM-19-022: 27.1 g/t Au over 0.50 metre;
BM-19-024: 32.4 g/t Au over 0.75 metre;
BM-19-025: 49.63 g/t Au over 2.35 metres including 145 g/t Au over 0.80 metre;
BM-19-030: 6.71 g/t Au over 3.05 metres including 26.3 g/t Au over 0.55 metre;
BM-19-033: 6.77 g/t Au over 3.50 metres;
BM-19-034: 43.6 g/t Au over 0.50 metre;
BM-19-036: 10.08 g/t Au over 2.70 metres;
BCVN-19-004:10.21 g/t Au over 3.30 metres;
BCVN-19-015: 21.91 g/t Au over 7.85 metres including 275 g/t Au over 0.60 metre;
BCVN-19-016: 5.72 g/t Au over 3.70 metres.
zum glück habe ich verkauft mit 50% miese .
und eldorado gold gekauft .
bei barkerville haben große jungs die finger im spiel.
die entscheiden wann es steigt
könnte ein 10 mio unzen projekt werden .
komme wieder(:
und eldorado gold gekauft .
bei barkerville haben große jungs die finger im spiel.
die entscheiden wann es steigt
könnte ein 10 mio unzen projekt werden .
komme wieder(:
Barkerville drills 5.2 m of 45.94 g/t Au at Island Mtn
https://www.stockwatch.com/News/Item.aspx?bid=Z-C%3aBGM-2786…
Wiedermal super Ergebnisse von Barkerville - es macht sich im Kurs noch nicht bemerktbar.
Unfassbar, vergleicht man die massiven Anstiege der peer group....
https://www.stockwatch.com/News/Item.aspx?bid=Z-C%3aBGM-2786…
Wiedermal super Ergebnisse von Barkerville - es macht sich im Kurs noch nicht bemerktbar.
Unfassbar, vergleicht man die massiven Anstiege der peer group....
hab mal etwas nachgekauft hier ....
Gold steigt , und bei BGM könnte nun der Turnarround kommen ...📈👍
Gold steigt , und bei BGM könnte nun der Turnarround kommen ...📈👍
Einfaches Einfügen von wallstreetONLINE Charts: So funktionierts.
Antwort auf Beitrag Nr.: 61.211.018 von senna7 am 08.08.19 21:51:43
Ohne Worte
😎.
Antwort auf Beitrag Nr.: 61.211.012 von senna7 am 08.08.19 21:50:53
Ahjo, also bist du verantwortlich für den gestrigen fulminanten Aufstieg hier? 🙄🙂🙃
Zitat von senna7: hab mal etwas nachgekauft hier ....
Ahjo, also bist du verantwortlich für den gestrigen fulminanten Aufstieg hier? 🙄🙂🙃
Das Resource World Magazine berichtet in der August/September-Ausgabe recht positiv über Barkerville (Seite 40/41).
Leider nicht online, nur für Abonnenten.
Freundliche Grüße
supernova
Leider nicht online, nur für Abonnenten.
Freundliche Grüße
supernova
Antwort auf Beitrag Nr.: 61.212.431 von 90BVB09 am 09.08.19 08:27:31
SICHER NICHT
ich bin ein winziger Krümmel KLEINST Anleger die Betonung liegt auf KLEINST
mit meinen paar Hunis
Zitat von 90BVB09:Zitat von senna7: hab mal etwas nachgekauft hier ....
Ahjo, also bist du verantwortlich für den gestrigen fulminanten Aufstieg hier? 🙄🙂🙃
SICHER NICHT
ich bin ein winziger Krümmel
KLEINST Anleger die Betonung liegt auf KLEINST mit meinen paar Hunis
Antwort auf Beitrag Nr.: 61.215.266 von senna7 am 09.08.19 13:36:33
... auch
aus einen Kleinstanleger kann mal ein Großer werden🙃
na ja das letzte Jahr lief ganz gut .... ( KL )
größer werd ich nur wenn Oroco durchstartet ( das ist mein 2020 und länger Play )
hier warte ich das uns einer aufkauft und gut bezahlt
größer werd ich nur wenn Oroco durchstartet ( das ist mein 2020 und länger Play
) hier warte ich das uns einer aufkauft und gut bezahlt
Barkerville's Cariboo PEA pegs after-tax NPV at $402.2M
Passable Ergebnisse der PEA. Market cap 156MUSD. NPV 402MUSD.IRR after taxes and mining duties 28.1%
NPV after taxes and mining duties $402.2-million
Preproduction construction costs (including $30-million contingency) $305.5-million
After-tax payback period (after start of operations) 3.1 years
Peak-year payable production 206,000 oz
Average LOM payable production 185,000 oz
PEA life of mine (LOM) 11 years
https://www.stockwatch.com/News/Item.aspx?bid=Z-C%3aBGM-2798…
Antwort auf Beitrag Nr.: 61.297.303 von TommyX11 am 20.08.19 10:14:55
- Freigaben vom Land speziell zu den Umweltauflagen
- Wie wird man finanzieren? Geht man zu diesen unterirdischen Kursen in eine KE?
- Wie schnell würde man das Ganze zum Laufen bekommen?
Grundsätzlich scheinen die Arbeiten ja schon angelaufen. Möglicherweise sind Teile der angegebenen Arbeiten schon erledigt. Leider bekommt man da zu wenig mit. Die Erweiterung der Mill jedenfalls war schon angekündigt...
Schade, dass es kein Board gibt (weder hier noch in CA oder US), das Barkerville genauer betrachtet und diskutiert.
Interessant wird auch sein, ob der Kurs jetzt noch weiter gedrückt wird, ggf. unter 30 CAD Cent, oder ob er sich wieder erholen darf. Das würde auch auf die mögliche Strategie bei der Kapitalbeschaffung hindeuten. Lässt man die freien Aktionäre mitverdienen, oder verleibt man sich das Ganze ein in OR, wie es beispielsweise Wexford bei Oro Mining gemacht hat...
Die PEA lässt einiges
an Spekulation zu. Speziell bei einen POG oberhalb von 1325 USD. Ob es der Aktie kurzfristig hilft...- Freigaben vom Land speziell zu den Umweltauflagen
- Wie wird man finanzieren? Geht man zu diesen unterirdischen Kursen in eine KE?
- Wie schnell würde man das Ganze zum Laufen bekommen?
Grundsätzlich scheinen die Arbeiten ja schon angelaufen. Möglicherweise sind Teile der angegebenen Arbeiten schon erledigt. Leider bekommt man da zu wenig mit. Die Erweiterung der Mill jedenfalls war schon angekündigt...
Schade, dass es kein Board gibt (weder hier noch in CA oder US), das Barkerville genauer betrachtet und diskutiert.
Interessant wird auch sein, ob der Kurs jetzt noch weiter gedrückt wird, ggf. unter 30 CAD Cent, oder ob er sich wieder erholen darf. Das würde auch auf die mögliche Strategie bei der Kapitalbeschaffung hindeuten. Lässt man die freien Aktionäre mitverdienen, oder verleibt man sich das Ganze ein in OR, wie es beispielsweise Wexford bei Oro Mining gemacht hat...
Antwort auf Beitrag Nr.: 61.306.168 von lale93 am 21.08.19 10:08:30http://gmpsecurities.bluematrix.com/sellside/EmailDocViewer?…
wäre schön wenn das Teil sich mal auf den Weg machen würde und einem nicht ständig das Gefühl vermittle sein Geld hier nur sinnlos geparkt zu haben. Positiv ist wenigstens , das Sie zZ stabil bleibt. Bei einem allgemeinen Abstieg wird sich das wohl schnell ändern.
Barkerville Gold Mines Announces Filing of the Preliminary Economic Assessment Technical Report for the Cariboo Gold Project
https://www.newswire.ca/news-releases/barkerville-gold-mines…
Antwort auf Beitrag Nr.: 61.508.294 von TommyX11 am 18.09.19 09:43:28
Ab 50 Cent werden die Schritte größer...
just my opinion...
ist schon extrem zäh
mittlerweile stimmt mich aber positiv, dass es nicht jeder Cent Anstieg sofort wieder abverkauft wird.Ab 50 Cent werden die Schritte größer...
just my opinion...
Antwort auf Beitrag Nr.: 61.536.662 von lale93 am 21.09.19 10:20:49Gibt es irgendwelche News?
Warum der Anstieg um 15% in D?
Ich konnte nix finden🤔....
Warum der Anstieg um 15% in D?
Ich konnte nix finden🤔....
Antwort auf Beitrag Nr.: 61.545.654 von buyer10 am 23.09.19 12:41:16Übernahme!
https://www.newswire.ca/news-releases/osisko-gold-royalties-…
Osisko Gold Royalties To Acquire Barkerville Gold Mines
Freundliche Grüße
supernova
https://www.newswire.ca/news-releases/osisko-gold-royalties-…
Osisko Gold Royalties To Acquire Barkerville Gold Mines
Freundliche Grüße
supernova
Under the terms of the Arrangement, each shareholder of Barkerville (excluding Osisko) will receive 0.0357 (the "Exchange Ratio") of a common share of Osisko for each share of Barkerville held. The Exchange Ratio implies consideration of C$0.58 per Barkerville share, based on the closing price of Osisko shares on the Toronto Stock Exchange (TSX) on September 20, 2019, representing a 44% premium based on both companies' trailing 20-day volume weighted average price (VWAP) as at September 20, 2019. The Exchange Ratio implies a total equity value of approximately C$338 million on a fully-diluted in the money basis, inclusive of Barkerville shares held by Osisko.
Hi supernova,
vielen Dank für die schnelle Rückmeldung!
Werde wahrscheinlich nicht in Osisko umtauschen sondern heute verkaufen😬.
vielen Dank für die schnelle Rückmeldung!
Werde wahrscheinlich nicht in Osisko umtauschen sondern heute verkaufen😬.
Wenn man umtauscht bekommt man stabile Streaming Aktie mit guter Dividende zur Zeit über 2 % aber das muss jeder selbts wissen und entscheiden
Ich werde sie nur verkaufen wenn der Markt mehr als die 0,58 zahlt .
Mal sehn wie beide Aktien dann reagieren.
https://www.goldinvest.de/aus-der-redaktion/2991-osisko-gold…
Ich werde sie nur verkaufen wenn der Markt mehr als die 0,58 zahlt .
Mal sehn wie beide Aktien dann reagieren.
https://www.goldinvest.de/aus-der-redaktion/2991-osisko-gold…
das war so klar ,schön verarscht worden
warum verarscht ?
erläutere das mal bitte .... solche Firmen sind nie vor Übernahmen sicher ...
und schlecht ist das auch nicht immer ....
Meine Crocodile zu Newmarket und nun Kirkland waren vervielfacher ....
hier immerhin einen Aufschlag von 44 % mehr als der Kurs am Freitag.
erläutere das mal bitte .... solche Firmen sind nie vor Übernahmen sicher ...
und schlecht ist das auch nicht immer ....
Meine Crocodile zu Newmarket und nun Kirkland waren vervielfacher ....
hier immerhin einen Aufschlag von 44 % mehr als der Kurs am Freitag.
ja kurs freitag aber wer ist schon freitag eingestiegen ,der kurs wird seit monaten gedrückt und jetzt ist auch klar warum .
osisko wird dann nochmal bohren und dann überaschenderweise 8 mio unzen zusätzlich finden.
osisko wird dann nochmal bohren und dann überaschenderweise 8 mio unzen zusätzlich finden.
Senna7
Der Kurs ist doch fast bei Allzeitlow gewesen, obwohl Gold bei 1500 ist. Gewinner sind nur die, die jetzt vor kurzem eingestiegen sind, oder massiv den Kurs gesenkt haben. Alle anderen sind tief im rot, wenn man mal schaut wo der Kurs früher war. Ich bin nach einem kurzen Intermezzo hier, mehr oder weniger, plus|minus, rausgegangen vor ein paar Monaten. Hatte es nicht verstanden, dass der Kurs einfach nicht angezogen ist.
Der Kurs ist doch fast bei Allzeitlow gewesen, obwohl Gold bei 1500 ist. Gewinner sind nur die, die jetzt vor kurzem eingestiegen sind, oder massiv den Kurs gesenkt haben. Alle anderen sind tief im rot, wenn man mal schaut wo der Kurs früher war. Ich bin nach einem kurzen Intermezzo hier, mehr oder weniger, plus|minus, rausgegangen vor ein paar Monaten. Hatte es nicht verstanden, dass der Kurs einfach nicht angezogen ist.
ok ich habe ja an den Tiefs nochmal verbilligt und bin nun sogar im Plus ....
auf der anderen Seite bin ich nicht überrascht das man sie übernimmt , eben weil der Kurs zu tief war ....
auf der anderen Seite bin ich nicht überrascht das man sie übernimmt , eben weil der Kurs zu tief war ....
Antwort auf Beitrag Nr.: 61.547.163 von johanderla am 23.09.19 15:33:18Klar hat Osisko die gedrückt und wurde alles schlechter dargestellt um sie billig zu bekommen.
Osisko weißt um die Stärke von BGM, daher werde ich an schwachen Tagen Osisko GR nachkaufen...
Finde den Streamer top und wahrscheinlich passiert mit Falco das gleiche.
Osisko baut hier was großes zusamen und hat eines der besten Managements
Osisko weißt um die Stärke von BGM, daher werde ich an schwachen Tagen Osisko GR nachkaufen...
Finde den Streamer top und wahrscheinlich passiert mit Falco das gleiche.
Osisko baut hier was großes zusamen und hat eines der besten Managements
Antwort auf Beitrag Nr.: 61.547.163 von johanderla am 23.09.19 15:33:18
Aber sei es drum. Raus aus den Scheiß, nächste Opportunity suchen. Gibt sicher noch einiges, das schön nach unten gedrückt wurde. Augen auf!
die brauchen nicht zufällig was finden
ist alles schon da. ca. 4 Mio Unzen Low Grade an der Oberfläche, die man angeblich Open Pit nicht abbauen darf und ca. 4,5 Mio Unzen unterirdisch, von denen nur die Hälfte in der Studie betrachtet wurden. Wenn das mal keine Verarsche ist.Aber sei es drum. Raus aus den Scheiß, nächste Opportunity suchen. Gibt sicher noch einiges, das schön nach unten gedrückt wurde. Augen auf!
Antwort auf Beitrag Nr.: 61.548.015 von lale93 am 23.09.19 16:46:59
schaut euch mal Falco an - für mich auf dem Niveau mit extremer Chance, da bisher nicht gelaufen und Osisko Management hat ebenfalls die Finger drin
schaut euch mal Falco an - für mich auf dem Niveau mit extremer Chance, da bisher nicht gelaufen und Osisko Management hat ebenfalls die Finger drin
Antwort auf Beitrag Nr.: 61.550.307 von lionbio am 23.09.19 21:00:00
Das wäre für mich nach der Geschichte hier ja eher ein Grund draußen zu bleiben
Zitat von lionbio: schaut euch mal Falco an - für mich auf dem Niveau mit extremer Chance, da bisher nicht gelaufen und Osisko Management hat ebenfalls die Finger drin
Das wäre für mich nach der Geschichte hier ja eher ein Grund draußen zu bleiben
Antwort auf Beitrag Nr.: 61.546.572 von senna7 am 23.09.19 14:29:53Hi senna7,
ja die 0,58 CAD wurden nicht gerissen und bin somit auch noch dabei. Obwohl ich noch Glück hatte und bei dem Wert im Plus bin, gefällt wir das "Tauschgeschäft" auch nicht wirklich.
Außerdem gibt der Osisko Kurs massiv nach (ca. minus 20% vom hoch) und somit ist auch die Barkerville- Aktie weniger wert. Warum OR jetzt so einbricht, verstehe ich schon gleich gar nicht, denn Barkerville ist/war auf dem jetzigen Niveau nicht teuer und sollte den Kurs beflügeln. Also für mich hinterlässt das ganze einen faden Beigeschmack und ob es so ein Erfolg wie Kirkland wird, bezweifle ich mal .
.
ja die 0,58 CAD wurden nicht gerissen und bin somit auch noch dabei. Obwohl ich noch Glück hatte und bei dem Wert im Plus bin, gefällt wir das "Tauschgeschäft" auch nicht wirklich
. Außerdem gibt der Osisko Kurs massiv nach (ca. minus 20% vom hoch) und somit ist auch die Barkerville- Aktie weniger wert. Warum OR jetzt so einbricht, verstehe ich schon gleich gar nicht, denn Barkerville ist/war auf dem jetzigen Niveau nicht teuer und sollte den Kurs beflügeln. Also für mich hinterlässt das ganze einen faden Beigeschmack und ob es so ein Erfolg wie Kirkland wird, bezweifle ich mal
 .
.
OR hat eine gute Gelegenheit genutzt um sich BGM zuholen. Frank G hat auch bei den Insider zugeschlagen. wusste er mehr?
Wie hoch ist sein Anteil noch?
Ich verkaufe nicht und nehme gerne die OR ist ein sehr guter Laden, ich liebe Royalty ans streaming Firmen. Laufen besser als Gold oder Minen Look MTA
Wie hoch ist sein Anteil noch?
Ich verkaufe nicht und nehme gerne die OR ist ein sehr guter Laden, ich liebe Royalty ans streaming Firmen. Laufen besser als Gold oder Minen Look MTA
Alles richtig ... man muss das aber wie hbc002 sehen ...
ich habe bisher noch keine Aktien von OR ( nur Osisko Mining ) und ja der "Übernehmer " wird jetzt erst mal abgestraft ...
Deshalb warte ich nun den Boden ab und kauf dann OR sogar auf eine runde Summe nach.
Auf längerer Sicht wird sich OR auch wieder erholen und BGM wird Ihnen dabei helfen.
OR ist zwar kein Rennpferd ( wie es bei BGM hätte sein können ) aber eine solide Langfristaktie
Bußler ab Min 9 ZU BGM
Antwort auf Beitrag Nr.: 61.589.568 von senna7 am 28.09.19 14:19:00
Die negative Stimmung aus den Beiträgen würde ich aber auch nicht teilen. Maximal bis zum Jahreswechsel.
Wenn Gold weiter steigt, geht OR wieder mit.
Mein Geld war anders investiert, Totalverlust einkalkuliert, deshalb musste ich da raus. Suche noch nach Alternativen. Bin am überlegen, ob Kobalt und Lithium mal wieder interessant werden. Nächstes Jahr fahren einige "Carmaker" ihre e-Auto Produktion hoch. Mal sehn, was dann mit der Lieferantenseite passiert.
Weiterhin viel Erfolg beim Investieren!
das siehst du schon richtig
OR ist sicherlich eine interessante Alternative, wenn jemand auf Nachhaltigkeit setzt. Dass wir in überschaubarer Zukunft bis zu 2 Jahren hier mehr als einen Verdoppler sehen, glaube ich aber nicht. Man muss ja auch sehen, dass OR um 30% verloren hat. Der Verdoppler wäre für einige dann gar nicht so viel...Die negative Stimmung aus den Beiträgen würde ich aber auch nicht teilen. Maximal bis zum Jahreswechsel.
Wenn Gold weiter steigt, geht OR wieder mit.
Mein Geld war anders investiert, Totalverlust einkalkuliert, deshalb musste ich da raus. Suche noch nach Alternativen. Bin am überlegen, ob Kobalt und Lithium mal wieder interessant werden. Nächstes Jahr fahren einige "Carmaker" ihre e-Auto Produktion hoch. Mal sehn, was dann mit der Lieferantenseite passiert.
Weiterhin viel Erfolg beim Investieren!
ISS and Glass Lewis Recommend that Barkerville Shareholders Vote FOR the Plan of Arrangement with Osisko Gold Royalties
https://www.newswire.ca/news-releases/iss-and-glass-lewis-re…
https://www.newswire.ca/news-releases/iss-and-glass-lewis-re…
Frage in die Runde: wer hat seine Osisko Aktien schon im Depot?
Bei mir ist noch nichts passiert...
Bei mir ist noch nichts passiert...
Antwort auf Beitrag Nr.: 62.040.665 von buyer10 am 29.11.19 09:06:12
Bei mir schon im DEPOT
Zitat von buyer10: Frage in die Runde: wer hat seine Osisko Aktien schon im Depot?
Bei mir ist noch nichts passiert...
Bei mir schon im DEPOT
Antwort auf Beitrag Nr.: 62.042.846 von senna7 am 29.11.19 13:22:50
Boden eben schon um die 1.454.
14:30 Uhr geht’s ab >> aber in welche Richtung???
Boden eben schon um die 1.454.
14:30 Uhr geht’s ab >> aber in welche Richtung???
Antwort auf Beitrag Nr.: 62.042.846 von senna7 am 29.11.19 13:22:50Bin bei Consors. Gerade eben nachgeschaut, aber es wurde noch nix umgebucht😭.
Werde mal nachfassen was da los ist....
Werde mal nachfassen was da los ist....
kommt schon noch nicht alle sind schnell ...
Antwort auf Beitrag Nr.: 62.043.188 von buyer10 am 29.11.19 14:13:01Bei der Consorsbank wurde jetzt auch eingebucht
Ziehen wir dann in diesen Thread um?
https://www.wallstreet-online.de/diskussion/1195074-101-110/…
Freundliche Grüße
supernova
https://www.wallstreet-online.de/diskussion/1195074-101-110/…
Freundliche Grüße
supernova
Antwort auf Beitrag Nr.: 62.060.399 von 90BVB09 am 02.12.19 17:44:19Danke für die Info👍😬
Beitrag zu dieser Diskussion schreiben
Zu dieser Diskussion können keine Beiträge mehr verfasst werden, da der letzte Beitrag vor mehr als zwei Jahren verfasst wurde und die Diskussion daraufhin archiviert wurde.
Bitte wenden Sie sich an feedback@wallstreet-online.de und erfragen Sie die Reaktivierung der Diskussion oder starten Sie eine neue Diskussion.
Investoren beobachten auch:
| Wertpapier | Perf. % |
|---|---|
| +21,53 | |
| +7,10 | |
| +0,46 | |
| +6,52 | |
| +2,61 | |
| 0,00 | |
| +2,33 | |
| 0,00 | |
| +5,20 | |
| -99,00 |
Meistdiskutiert
| Wertpapier | Beiträge | |
|---|---|---|
| 209 | ||
| 102 | ||
| 100 | ||
| 61 | ||
| 54 | ||
| 39 | ||
| 38 | ||
| 34 | ||
| 33 | ||
| 28 |


