


Meine kleine Sammlung an Börsenstatistiken (Seite 3)
eröffnet am 02.08.17 21:51:33 von
neuester Beitrag 03.01.24 14:57:17 von
neuester Beitrag 03.01.24 14:57:17 von
Beiträge: 204
ID: 1.258.587
ID: 1.258.587
Aufrufe heute: 4
Gesamt: 23.554
Gesamt: 23.554
Aktive User: 0
ISIN: US78378X1072 · WKN: CG3AA5
5.065,04
PKT
+0,19 %
+9,80 PKT
Letzter Kurs 17.04.24 Citigroup
Neuigkeiten
03.05.24 · wallstreetONLINE Redaktion |
07:35 Uhr · dpa-AFX |
04.05.24 · HSBC Zertifikate Anzeige |
03.05.24 · dpa-AFX |
03.05.24 · dpa-AFX |
 Non-Farm Payrolls: US-Arbeitsmarkt wächst deutlich geringer als erwartet – der Markt jubelt!
Beitrag zu dieser Diskussion schreiben
“The supposedly all-weather 60/40 portfolio is not ready for stagflation,” said Nancy Davis, founder of Quadratic Capital Management.
...
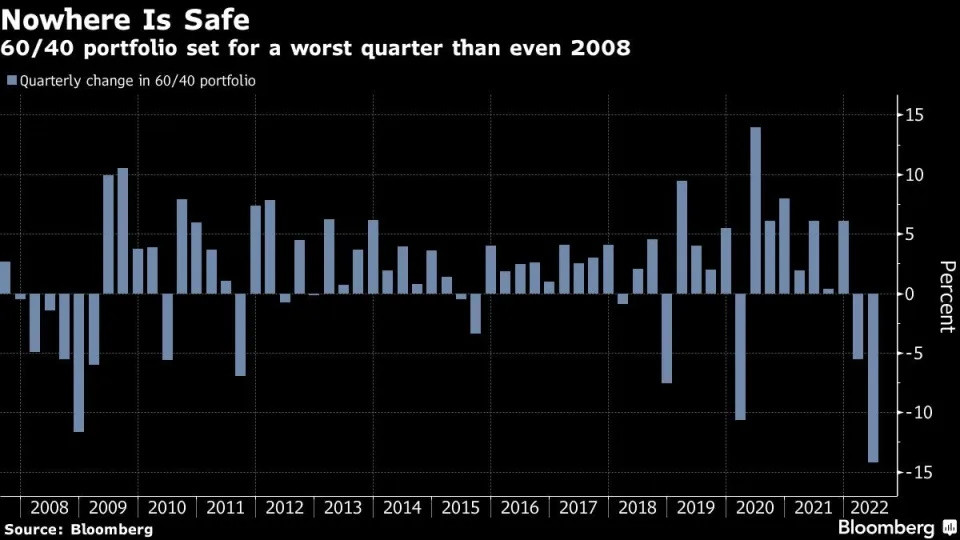
Wall Street pros are famously still at loggerheads over the fate of the trillion-dollar 60/40 complex -- only this time the balanced investment strategy is posting losses on a scale that’s shocking even its biggest critics.
With stocks and Treasuries tumbling anew thanks to the Federal Reserve’s increasingly hawkish policy direction, the time-honored method of allocating 60% to equities and 40% to fixed income has plunged about 14% so far this quarter. That’s a worse quarterly showing than in depths of the global financial crisis and during the once-in-a-century pandemic rout, according to data compiled by Bloomberg.
It’s the latest sign that the hedging power of bonds continues to vanish in the inflation era, sparking wealth destruction across American pension funds.
God help those paid to figure out if the asset class will break out of its existential funk or founder. It’s an increasingly high-stakes bet on whether the world succumbs to yet-more inflation, a recession or even stagflation.
Goldman Sachs Group Inc., for its part, thinks Treasuries remain dead as a hedge as central bankers tighten policy big time. By contrast, the likes of JPMorgan Asset Management reckon yields at multi-year highs will help bonds deliver the goods in the next crash.
“During 2008-2009, the utter collapse of stocks was a brutal hit to performance,” wrote Bespoke Investment Group analysts in a note. “But despite an enormous surge in credit spreads, bonds didn’t drop very far or for very long.”
Over the past decade, the likes of pension funds invested on the conviction that bonds would reliably keep producing steady income to offset equity losses in any market downturn. It largely worked, with the 60/40 strategy only ending down in two of the past 15 years -- all while posting modest volatility to boot. Even in the throes of the financial crisis, when stocks sapped performance, rallying Treasuries softened portfolio losses.
But this year, inflation has become a risk too big to hedge, hitting both bonds and equities together. The cross-asset selloff intensified in the past week thanks to the biggest Fed interest-rate increase since 1994 with another jumbo hike in the offing. All that is hurting American pension funds to a degree that few saw possible even just weeks ago.
...
19.6.
Wall Street’s Classic Strategy Set for Worse Quarter Than 2008
https://finance.yahoo.com/news/wall-street-alarms-bell-60-18…

...
Wall Street pros are famously still at loggerheads over the fate of the trillion-dollar 60/40 complex -- only this time the balanced investment strategy is posting losses on a scale that’s shocking even its biggest critics.
With stocks and Treasuries tumbling anew thanks to the Federal Reserve’s increasingly hawkish policy direction, the time-honored method of allocating 60% to equities and 40% to fixed income has plunged about 14% so far this quarter. That’s a worse quarterly showing than in depths of the global financial crisis and during the once-in-a-century pandemic rout, according to data compiled by Bloomberg.
It’s the latest sign that the hedging power of bonds continues to vanish in the inflation era, sparking wealth destruction across American pension funds.
God help those paid to figure out if the asset class will break out of its existential funk or founder. It’s an increasingly high-stakes bet on whether the world succumbs to yet-more inflation, a recession or even stagflation.
Goldman Sachs Group Inc., for its part, thinks Treasuries remain dead as a hedge as central bankers tighten policy big time. By contrast, the likes of JPMorgan Asset Management reckon yields at multi-year highs will help bonds deliver the goods in the next crash.
“During 2008-2009, the utter collapse of stocks was a brutal hit to performance,” wrote Bespoke Investment Group analysts in a note. “But despite an enormous surge in credit spreads, bonds didn’t drop very far or for very long.”
Over the past decade, the likes of pension funds invested on the conviction that bonds would reliably keep producing steady income to offset equity losses in any market downturn. It largely worked, with the 60/40 strategy only ending down in two of the past 15 years -- all while posting modest volatility to boot. Even in the throes of the financial crisis, when stocks sapped performance, rallying Treasuries softened portfolio losses.
But this year, inflation has become a risk too big to hedge, hitting both bonds and equities together. The cross-asset selloff intensified in the past week thanks to the biggest Fed interest-rate increase since 1994 with another jumbo hike in the offing. All that is hurting American pension funds to a degree that few saw possible even just weeks ago.
...
19.6.
Wall Street’s Classic Strategy Set for Worse Quarter Than 2008
https://finance.yahoo.com/news/wall-street-alarms-bell-60-18…
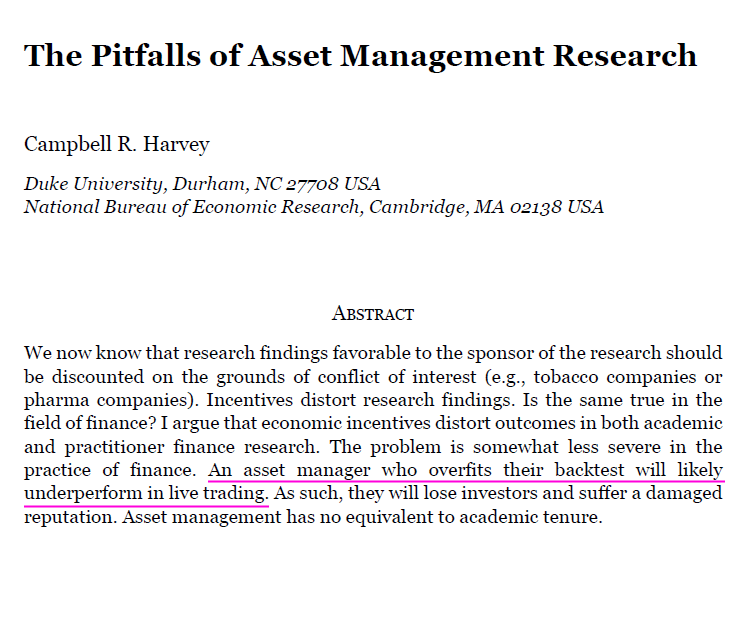
The Pitfalls of Asset Management Research
13 Pages Posted: 5 May 2022
Campbell R. Harvey
Duke University - Fuqua School of Business; National Bureau of Economic Research (NBER)
https://papers.ssrn.com/sol3/papers.cfm?abstract_id=4078138
...
How can we improve?
The problem of p-hacking is not unique to finance. Indeed, many other academic areas are realizing they have the same problem and are taking steps to address it. Indeed, the cost of p-hacking is arguably much higher in medical research—where a study’s results might mean the difference between life and death—than in finance where the primary concern is the size of the alpha.
Curiously, we are experiencing an ongoing debate in academic finance about whether p-hacking in financial research is a crisis. Our field is not special compared to other fields of study and does not warrant a free pass.
Investors can take a number of steps to mitigate the problem. First, be skeptical of both academic and practitioner research. Often a predetermined agenda or incentives make the results seem stronger than they are.
Second, take the research culture into account. For example, when presented with a new strategy, ask if the company keeps a record of all variables that were tried.
Third, try to quantify the costs of different mistakes (selecting a bad manager versus missing a good manager, see Harvey and Liu (2020b)).
Fourth, make sure the strategy has a solid economic foundation. Also, beware of ex-post theorizing (after discovering the result, a story is concocted).
Fifth, strategically ask questions such as “Did you try X?” If the answer is “Yes, and it does not work” and X is not reported, interpret this as a red flag. On seeing one cockroach, you can safely assume a dozen are behind the wall.
13 Pages Posted: 5 May 2022
Campbell R. Harvey
Duke University - Fuqua School of Business; National Bureau of Economic Research (NBER)
https://papers.ssrn.com/sol3/papers.cfm?abstract_id=4078138

...
How can we improve?
The problem of p-hacking is not unique to finance. Indeed, many other academic areas are realizing they have the same problem and are taking steps to address it. Indeed, the cost of p-hacking is arguably much higher in medical research—where a study’s results might mean the difference between life and death—than in finance where the primary concern is the size of the alpha.
Curiously, we are experiencing an ongoing debate in academic finance about whether p-hacking in financial research is a crisis. Our field is not special compared to other fields of study and does not warrant a free pass.
Investors can take a number of steps to mitigate the problem. First, be skeptical of both academic and practitioner research. Often a predetermined agenda or incentives make the results seem stronger than they are.
Second, take the research culture into account. For example, when presented with a new strategy, ask if the company keeps a record of all variables that were tried.
Third, try to quantify the costs of different mistakes (selecting a bad manager versus missing a good manager, see Harvey and Liu (2020b)).
Fourth, make sure the strategy has a solid economic foundation. Also, beware of ex-post theorizing (after discovering the result, a story is concocted).
Fifth, strategically ask questions such as “Did you try X?” If the answer is “Yes, and it does not work” and X is not reported, interpret this as a red flag. On seeing one cockroach, you can safely assume a dozen are behind the wall.
2022
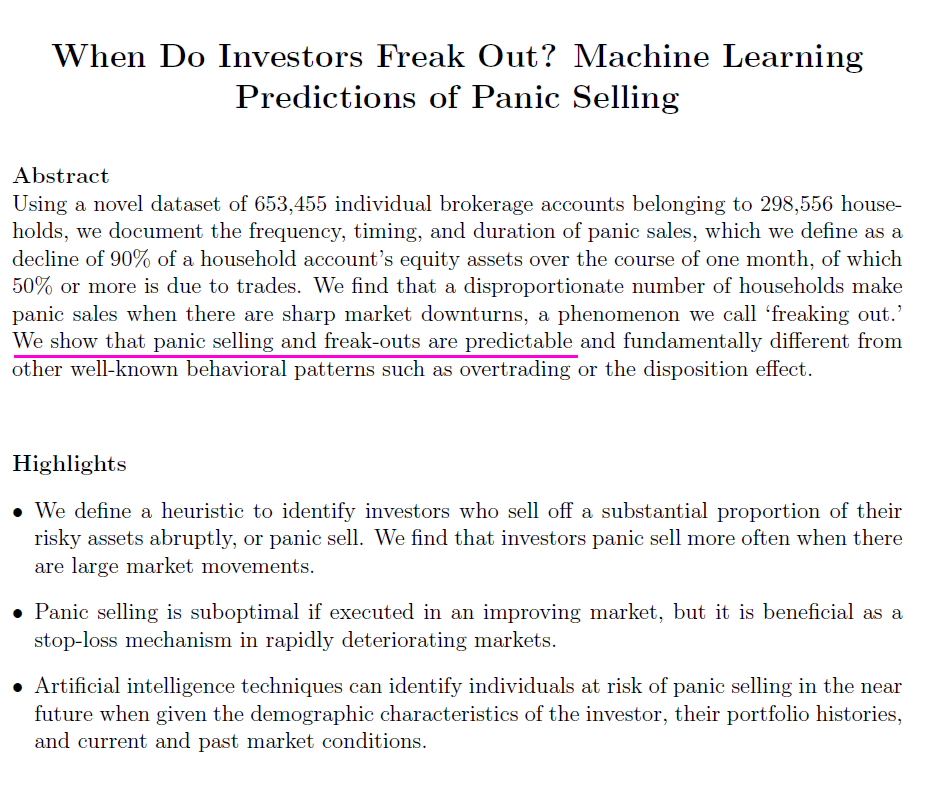
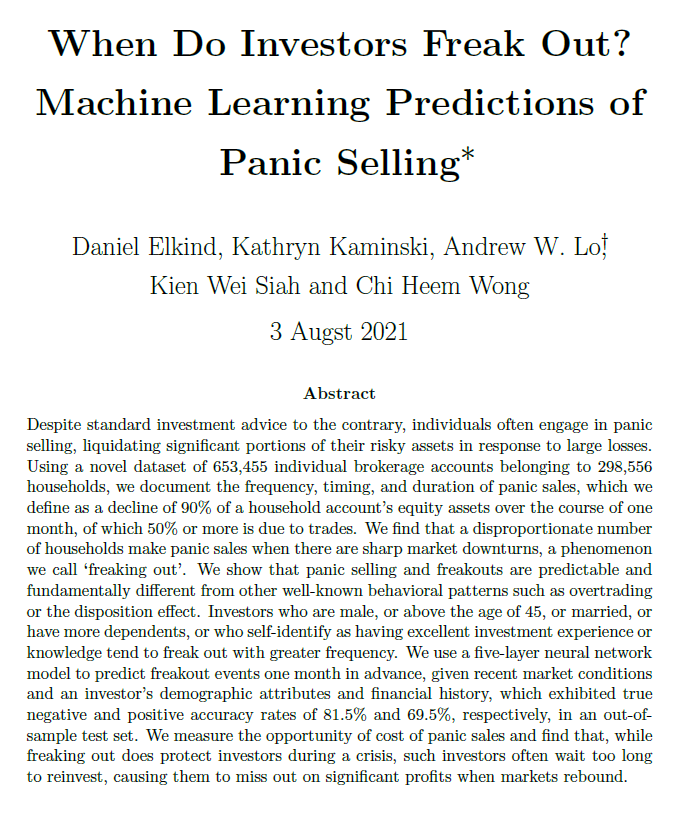
When Do Investors Freak Out? Machine Learning Predictions of Panic Selling
MIT Laboratory for Financial Engineering
https://jfds.pm-research.com/content/4/1/11
...
...
Second, we find that 30.9% of the investors who panic sell never return to reinvest in risky assets; however, of those who do, more than 58.5% reenter the market within half a year.
Third, we analyze the demographics of the investors who tend to ‘freak out’ under our definition (i.e., they make panic sales during periods of sharp market downturns), and find that a higher proportion of investors who are male, above the age of 45, married, have a greater number of dependents, or have declared themselves to have excellent investment experience or knowledge tend to freak out. (*)
Fourth, we find that the median investor earns a zero to negative return after panic selling. Calculating the opportunity cost of panic selling over time reveals that panic selling is suboptimal if executed in an improving market, but it is beneficial as a stop-loss mechanism in rapidly deteriorating markets.
Finally, we develop machine learning models to predict when investors might panic sell in the near future. Our set of predictive features includes the demographic characteristics of the investor, the investor’s portfolio histories, and current and past market conditions. This task is made difficult by the extreme rarity of panic sales. Nonetheless, our best-performing deep neural network achieves a 69.5% true positive accuracy rate and an 81.2% true negative accuracy rate, demonstrating that artificial intelligence techniques can assist in identifying individuals at risk of panic selling in the near future.
...
Panic sales are not random events. Specific types of investor, such as those with less than $20,000 in portfolio value, tend to liquidate more frequently than others. Subtle patterns in portfolio history, past market movements, and demographic profile can be exploited by deep neural networks to accurately predict whether an investor will panic sell in the near future.
Unfortunately, the problem of causation cannot be addressed with the data we have.
Therefore, our study does not address why investors panic sell. This topic, however, would doubtless be an interesting direction for future research.
___
(*) diese Anlegerklasse kann man mMn auch gut in den (deutschsprachigen) "Gold- und Crash-Foren" bei WO beobachten
When Do Investors Freak Out? Machine Learning Predictions of Panic Selling
MIT Laboratory for Financial Engineering
https://jfds.pm-research.com/content/4/1/11
...

...
Second, we find that 30.9% of the investors who panic sell never return to reinvest in risky assets; however, of those who do, more than 58.5% reenter the market within half a year.
Third, we analyze the demographics of the investors who tend to ‘freak out’ under our definition (i.e., they make panic sales during periods of sharp market downturns), and find that a higher proportion of investors who are male, above the age of 45, married, have a greater number of dependents, or have declared themselves to have excellent investment experience or knowledge tend to freak out. (*)
Fourth, we find that the median investor earns a zero to negative return after panic selling. Calculating the opportunity cost of panic selling over time reveals that panic selling is suboptimal if executed in an improving market, but it is beneficial as a stop-loss mechanism in rapidly deteriorating markets.
Finally, we develop machine learning models to predict when investors might panic sell in the near future. Our set of predictive features includes the demographic characteristics of the investor, the investor’s portfolio histories, and current and past market conditions. This task is made difficult by the extreme rarity of panic sales. Nonetheless, our best-performing deep neural network achieves a 69.5% true positive accuracy rate and an 81.2% true negative accuracy rate, demonstrating that artificial intelligence techniques can assist in identifying individuals at risk of panic selling in the near future.
...
Panic sales are not random events. Specific types of investor, such as those with less than $20,000 in portfolio value, tend to liquidate more frequently than others. Subtle patterns in portfolio history, past market movements, and demographic profile can be exploited by deep neural networks to accurately predict whether an investor will panic sell in the near future.
Unfortunately, the problem of causation cannot be addressed with the data we have.
Therefore, our study does not address why investors panic sell. This topic, however, would doubtless be an interesting direction for future research.
___
(*) diese Anlegerklasse kann man mMn auch gut in den (deutschsprachigen) "Gold- und Crash-Foren" bei WO beobachten

S&P 500: 6-Monats-Durchschnitte der Renditen (saisonal):
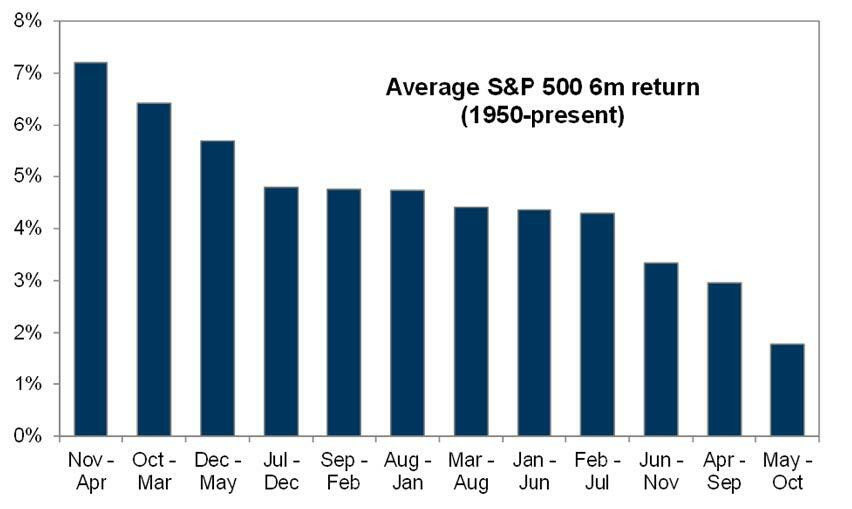
https://www.zerohedge.com/markets/goldman-trader-state-marke…

https://www.zerohedge.com/markets/goldman-trader-state-marke…
Zum TeamViewer-Desaster z.Z.:
nein, Preise an nicht-manipulierten Finanzmärkten entstehen weitestgehend zufällig.
Auch der Kursverlauf der TeamViewer-Aktie entspricht weitestgehend, aber nicht vollständig, dem einer Zufallsvariablen. Auch hier sind die Preise in grober Näherung lognormal-verteilt.
(siehe z.B. Random Walks, John Norstad, retired, Northwestern University)
Zitat von Dreiseitensteak: ...Preise werden gemacht, sie entstehen nicht zufällig.
...
nein, Preise an nicht-manipulierten Finanzmärkten entstehen weitestgehend zufällig.
Auch der Kursverlauf der TeamViewer-Aktie entspricht weitestgehend, aber nicht vollständig, dem einer Zufallsvariablen. Auch hier sind die Preise in grober Näherung lognormal-verteilt.
(siehe z.B. Random Walks, John Norstad, retired, Northwestern University)
Trading Spotlight
Antwort auf Beitrag Nr.: 62.343.740 von faultcode am 11.01.20 02:09:36
ich halte mal fest:
26.01.2021
<ich räume gerade den PC auf und beim Einsortieren bin ich über dieses alte Verzeichnis gestoßen: "Trading strategies and Risk factors/TSI-System, DER AKTIONÄR" >
>
Zitat von faultcode: das "TSI-System" ("TSI-Depot") des AKTIONÄRS wird wieder überarbeitet:
...
ich halte mal fest:
26.01.2021
Zitat von elmago: ...
Das TSI-System im Aktionär ist nicht viel wert, denn es wird als Musterdepot dargestellt, wo alle Kosten und Steuern unterschlagen werden. Dieser Thread entstand übrigens wegen der Schwächen des TSI 2.0.
Ich habe mal den TSI 2.0 über 5 Jahre nachgebildet, und zwar ohne Kosten und Steuern (siehe Chart). Mit einem DAX-ETF (buy and hold) fährst Du besser, weil während der Haltedauer keine Steuern und Kosten anfallen.
...
<ich räume gerade den PC auf und beim Einsortieren bin ich über dieses alte Verzeichnis gestoßen: "Trading strategies and Risk factors/TSI-System, DER AKTIONÄR"
 >
>
Antwort auf Beitrag Nr.: 69.572.544 von faultcode am 12.10.21 14:50:58
so in etwa
<oben ist ein Wochen-Chart => "Kurtosis(3)" in magenta mit (45,52,45) x 5 = (225,260,225)>
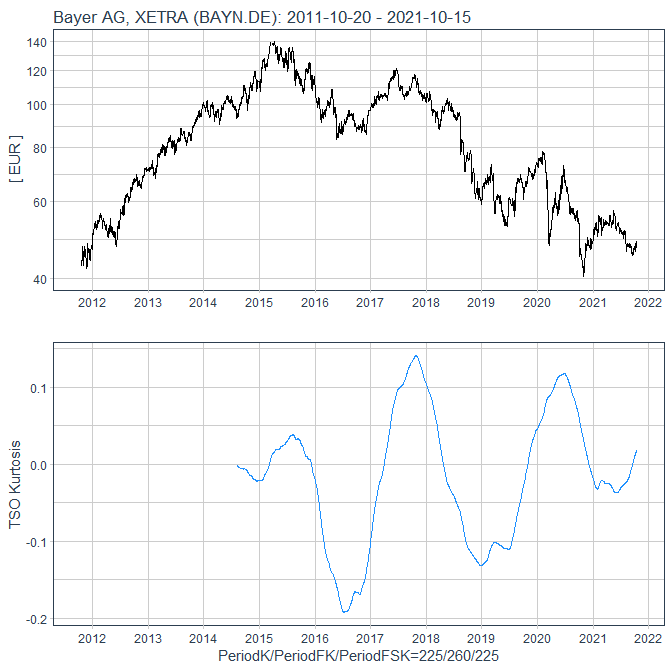
--> pastebin: https://pastebin.com/rRi13vRw
Zitat von faultcode: ...
c/ die "TSO-Pseudo-Kurtosis" (zweifach geglätteter Zweifach-Momentum-Indikator), die ich nun wohl in R + ggplot2 nachbauen werde: https://www.wallstreet-online.de/diskussion/1258587-71-80/kl…
...
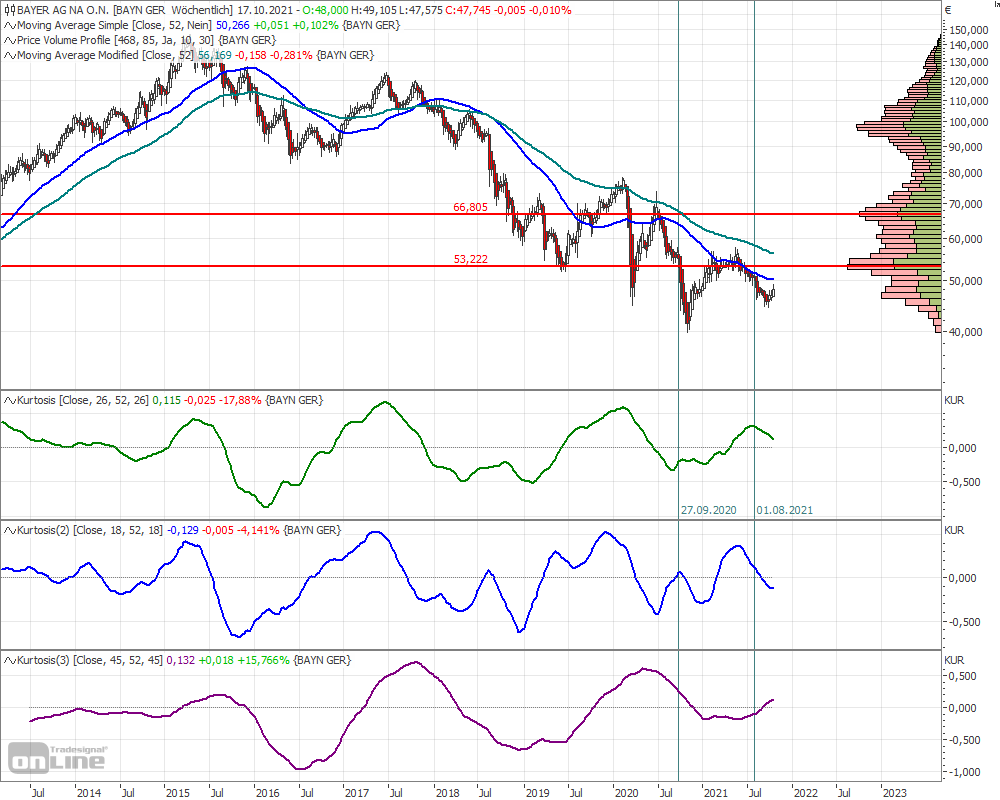
so in etwa
<oben ist ein Wochen-Chart => "Kurtosis(3)" in magenta mit (45,52,45) x 5 = (225,260,225)>

--> pastebin: https://pastebin.com/rRi13vRw
Antwort auf Beitrag Nr.: 69.572.544 von faultcode am 12.10.21 14:50:58HTML5 in der Chartechnik:
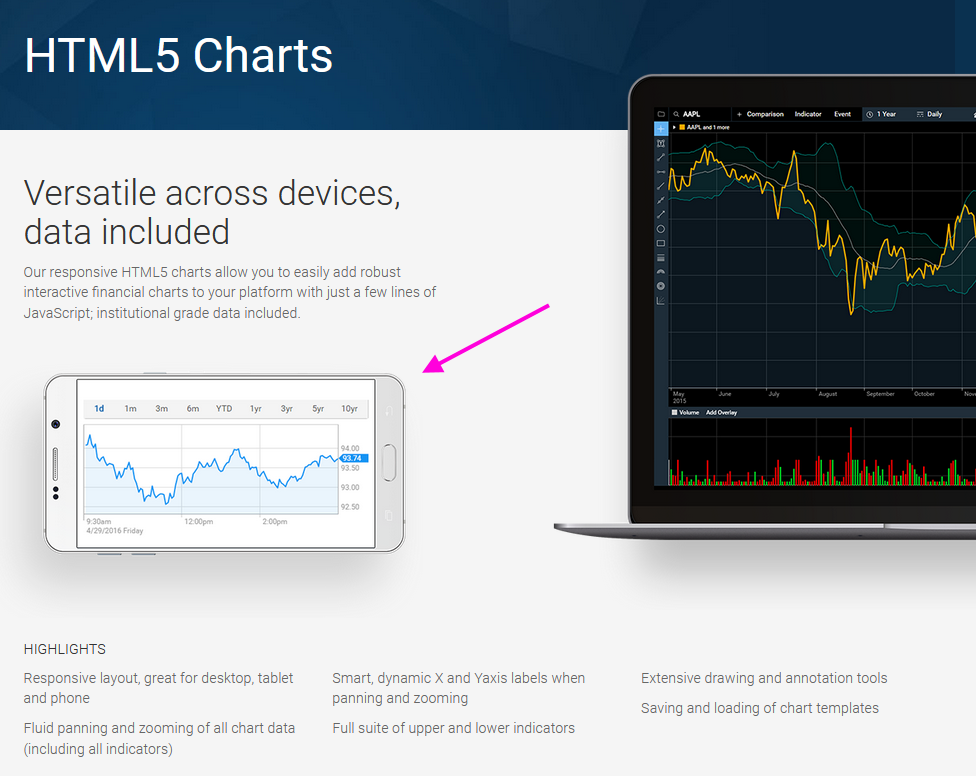
ich habe keine Ahnung welche Frameworks TSO benutzt, sehe aber, daß HTML5 + JavaScript für die Chartechnik im Web massiv um sich gergriffen hat.
Auch TradingView benutzt es: https://www.tradingview.com/HTML5-stock-forex-bitcoin-charti…
Hier, und woanders, scheint wohl der geradezu manische Zwang zur "Mobility" oft ausschlaggebend gewesen zu sein: HTML5 Canvas technology ensures that (unlike pictures) this chart will always look perfect on any device.
z.B.:
www.chartworks.io
Der rasche und massive Aufstieg der "Mobile Stock-Trading App Robinhood" ist hier mMn Ursache und Sympton zugleich.
=> für mich sind aber "Pictures" (ohne Echtzeit- und Intraday-Daten) auf dem Windows 10-Desktop gut genug
Im Hintergrund spielt mMn auch der anhaltende Krypto-Boom eine Rolle; ein Umfeld, wo ganz offensichtlich kein besonderer Wert auf ausgefeiltere Charts gelegt wird.
Und ich meine Technical stock charts, also keine Watchlisten oder Portfolio-Verwaltung mit Analysen oder Dashboards mit Market overviews.
Und auch kein Wertpapierhandel aus einer App heraus; ja, dort war/ist das große Geld mit zu machen. Zumindest hoffen das die Macher
nebenbei: Volume by price charts (volume profile) sind bei der ansonsten hochgelobten Koyfin-Plattform wo zu finden?
ich habe keine Ahnung welche Frameworks TSO benutzt, sehe aber, daß HTML5 + JavaScript für die Chartechnik im Web massiv um sich gergriffen hat.
Auch TradingView benutzt es: https://www.tradingview.com/HTML5-stock-forex-bitcoin-charti…
Hier, und woanders, scheint wohl der geradezu manische Zwang zur "Mobility" oft ausschlaggebend gewesen zu sein: HTML5 Canvas technology ensures that (unlike pictures) this chart will always look perfect on any device.
z.B.:

www.chartworks.io
Der rasche und massive Aufstieg der "Mobile Stock-Trading App Robinhood" ist hier mMn Ursache und Sympton zugleich.
=> für mich sind aber "Pictures" (ohne Echtzeit- und Intraday-Daten) auf dem Windows 10-Desktop gut genug
Im Hintergrund spielt mMn auch der anhaltende Krypto-Boom eine Rolle; ein Umfeld, wo ganz offensichtlich kein besonderer Wert auf ausgefeiltere Charts gelegt wird.
Und ich meine Technical stock charts, also keine Watchlisten oder Portfolio-Verwaltung mit Analysen oder Dashboards mit Market overviews.
Und auch kein Wertpapierhandel aus einer App heraus; ja, dort war/ist das große Geld mit zu machen. Zumindest hoffen das die Macher
nebenbei: Volume by price charts (volume profile) sind bei der ansonsten hochgelobten Koyfin-Plattform wo zu finden?
TSO (Tradesignal Online) macht nun Schluss für Retail bis Ende 2021, was mMn sehr schade ist, auch wenn ich es nur ab und zu nutzte, um schnell durch meine Chart-Templates zu flippen:
https://www.tradesignalonline.com

Guidants (https://go.guidants.com) und auch TradingView (https://www.tradingview.com) aus UK sind (bislang) keine Alternative für mich, auch nicht gegen Bezahlung.
Denn ich schätzte an TSO 3 Dinge ganz besonders:
a/ sehr gute Übersichtlichkeit mit indiv. Chart-Template für jedes Wertpapier (> 100)
b/ Volume-at-Price-Charts der besseren Art
c/ die "TSO-Pseudo-Kurtosis" (zweifach geglätteter Zweifach-Momentum-Indikator), die ich nun wohl in R + ggplot2 nachbauen werde: https://www.wallstreet-online.de/diskussion/1258587-71-80/kl…
TradingView macht zunächst einen guten Eindruck, aber das individuelle Chart-Templating bei Beibehaltung einer guten Übersicht ist mir ein Rätsel (ohne vielleicht zu den Super-Produkten dort greifen zu müssen, was bei mir zur Folge hat, mich schleichend an eine Plattform zu binden):
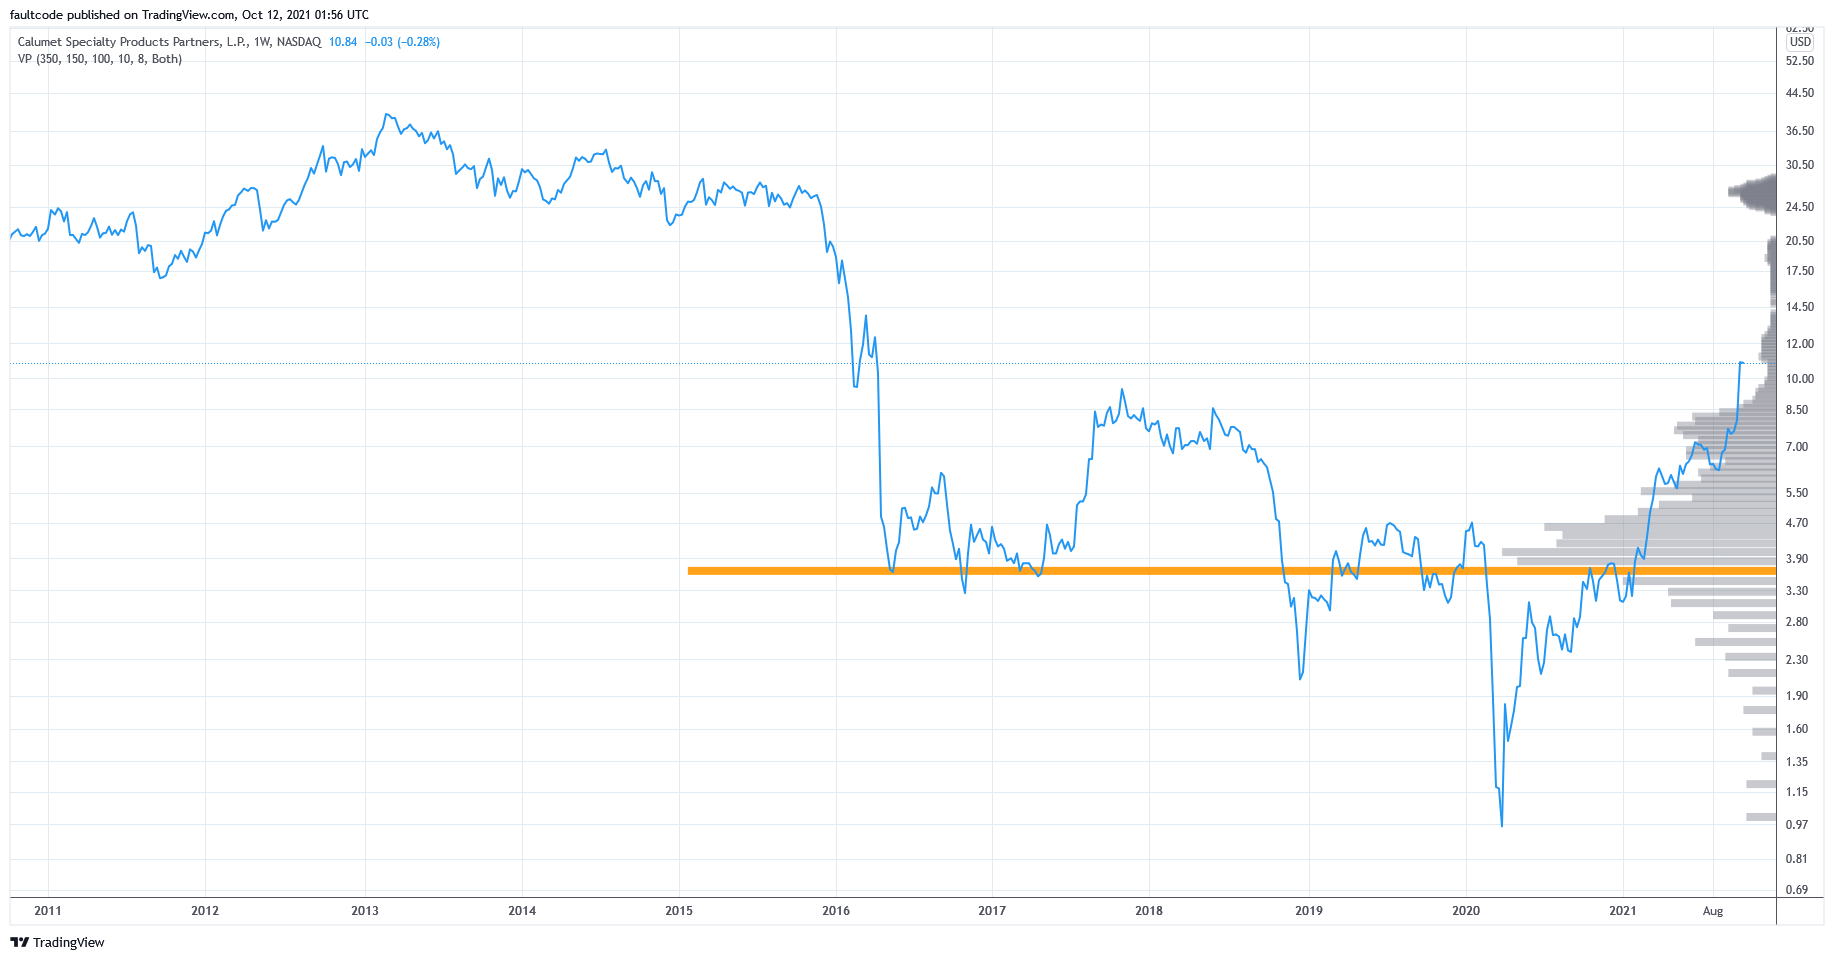
nebenbei: der Volume-at-Price-Teil oben bei TradingView war ein ziemliches Gefummel. Kein Vergleich zu TSO.
zuletzt: bei StockCharts gebe ich z.B. Bilfinger ein und die finden nichts: https://stockcharts.com/search/?section=symbols&q=bilfinger
Ich seh schon: am Ende muss ich wohl ein Monster-Python-Programm schreiben zur individuellen Massen-Chart-Generierung auf Knopfdruck, wozu ich aber eigentlich wenig Lust habe
Nun werde ich lauter Hardcopies bei TSO machen, um zu sehen, was ich mir da die letzten Jahre zusammenbastelte.
https://www.tradesignalonline.com

Guidants (https://go.guidants.com) und auch TradingView (https://www.tradingview.com) aus UK sind (bislang) keine Alternative für mich, auch nicht gegen Bezahlung.
Denn ich schätzte an TSO 3 Dinge ganz besonders:
a/ sehr gute Übersichtlichkeit mit indiv. Chart-Template für jedes Wertpapier (> 100)
b/ Volume-at-Price-Charts der besseren Art
c/ die "TSO-Pseudo-Kurtosis" (zweifach geglätteter Zweifach-Momentum-Indikator), die ich nun wohl in R + ggplot2 nachbauen werde: https://www.wallstreet-online.de/diskussion/1258587-71-80/kl…

TradingView macht zunächst einen guten Eindruck, aber das individuelle Chart-Templating bei Beibehaltung einer guten Übersicht ist mir ein Rätsel (ohne vielleicht zu den Super-Produkten dort greifen zu müssen, was bei mir zur Folge hat, mich schleichend an eine Plattform zu binden):

nebenbei: der Volume-at-Price-Teil oben bei TradingView war ein ziemliches Gefummel. Kein Vergleich zu TSO.
zuletzt: bei StockCharts gebe ich z.B. Bilfinger ein und die finden nichts: https://stockcharts.com/search/?section=symbols&q=bilfinger
Ich seh schon: am Ende muss ich wohl ein Monster-Python-Programm schreiben zur individuellen Massen-Chart-Generierung auf Knopfdruck, wozu ich aber eigentlich wenig Lust habe
Nun werde ich lauter Hardcopies bei TSO machen, um zu sehen, was ich mir da die letzten Jahre zusammenbastelte.
Antwort auf Beitrag Nr.: 69.454.645 von faultcode am 29.09.21 14:46:36https://papers.ssrn.com/sol3/papers.cfm?abstract_id=3898940 -->
...
ich habe schon den ersten Fehler gefunden auf Seite 26 in der Conclusion
While the disposition effect claims that investors tend to hold on to their losers and keep their winners,..
--> es muss heißen: ...sell their winners
...
Panic selling and freakouts often have negative connotations. We show that this negativity may not always be warranted. While panic selling in normal market conditions is indeed harmful to the median retail investor, freaking out in environments of sustained market decline prevents further losses and protects one's capital. (*)
Panic sales are not random events. Specifc types of investor, such as those with less than $20000 in portfolio value, tend to liquidate more frequently than others. Subtle patterns in portfolio history, past market movements, and demographic prole can be exploited by deep neural networks to accurately predict if an investor will panic sell in the near future.
Unfortunately, the problem of causation cannot be addressed with the data we have. Therefore, our study does not address why investors panic sell. This topic, however, would doubtless be an interesting direction for future research.
(*) alte Börsenweisheit: if you’re going to panic, panic early

...
ich habe schon den ersten Fehler gefunden auf Seite 26 in der Conclusion
While the disposition effect claims that investors tend to hold on to their losers and keep their winners,..
--> es muss heißen: ...sell their winners
...
Panic selling and freakouts often have negative connotations. We show that this negativity may not always be warranted. While panic selling in normal market conditions is indeed harmful to the median retail investor, freaking out in environments of sustained market decline prevents further losses and protects one's capital. (*)
Panic sales are not random events. Specifc types of investor, such as those with less than $20000 in portfolio value, tend to liquidate more frequently than others. Subtle patterns in portfolio history, past market movements, and demographic prole can be exploited by deep neural networks to accurately predict if an investor will panic sell in the near future.
Unfortunately, the problem of causation cannot be addressed with the data we have. Therefore, our study does not address why investors panic sell. This topic, however, would doubtless be an interesting direction for future research.
(*) alte Börsenweisheit: if you’re going to panic, panic early
Meine kleine Sammlung an Börsenstatistiken


