


silber_overbought_trigger - 500 Beiträge pro Seite
eröffnet am 15.05.06 19:01:27 von
neuester Beitrag 26.01.07 19:49:21 von
neuester Beitrag 26.01.07 19:49:21 von
Beiträge: 35
ID: 1.060.200
ID: 1.060.200
Aufrufe heute: 0
Gesamt: 5.331
Gesamt: 5.331
Aktive User: 0
Top-Diskussionen
| Titel | letzter Beitrag | Aufrufe |
|---|---|---|
| 01.05.24, 18:36 | 1738 | |
| heute 09:56 | 1675 | |
| vor 18 Minuten | 1220 | |
| gestern 18:35 | 755 | |
| vor 32 Minuten | 696 | |
| heute 08:17 | 688 | |
| vor 1 Stunde | 621 | |
| gestern 19:24 | 531 |
Meistdiskutierte Wertpapiere
| Platz | vorher | Wertpapier | Kurs | Perf. % | Anzahl | ||
|---|---|---|---|---|---|---|---|
| 1. | 1. | 18.001,60 | +0,59 | 240 | |||
| 2. | 2. | 168,20 | +0,08 | 87 | |||
| 3. | 3. | 9,7000 | +12,27 | 75 | |||
| 4. | 14. | 6,1400 | -1,35 | 69 | |||
| 5. | 11. | 0,1865 | 0,00 | 52 | |||
| 6. | 7. | 0,8750 | -12,50 | 47 | |||
| 7. | 12. | 0,1561 | +2,97 | 38 | |||
| 8. | 6. | 2.302,50 | 0,00 | 36 |
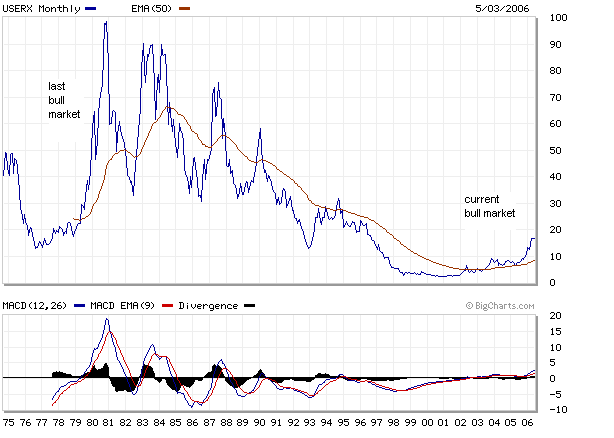
hier sehe ich noch nichts im overbought-Bereich
mit Anlagehorizont von 24 Monaten
siehe auch www.stockcharts.com Kuerzel: USERX
http://www.gold-eagle.com/editorials_05/chan050906.html
mit Anlagehorizont von 24 Monaten
siehe auch www.stockcharts.com Kuerzel: USERX
http://www.gold-eagle.com/editorials_05/chan050906.html
http://www.financialsense.com/Market/cpuplava/2006/0512.html" target="_blank" rel="nofollow ugc noopener">
http://www.financialsense.com/Market/cpuplava/2006/0512.html

http://www.financialsense.com/Market/cpuplava/2006/0512.html
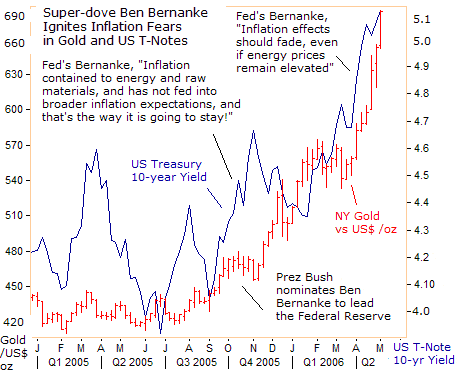
die 10year-Tresury-Yield
bei www.stockcharts.com Kuerzel: $TNX
http://www.321gold.com/editorials/sirchartsalot/dorsch051006…
bei www.stockcharts.com Kuerzel: $TNX
http://www.321gold.com/editorials/sirchartsalot/dorsch051006…
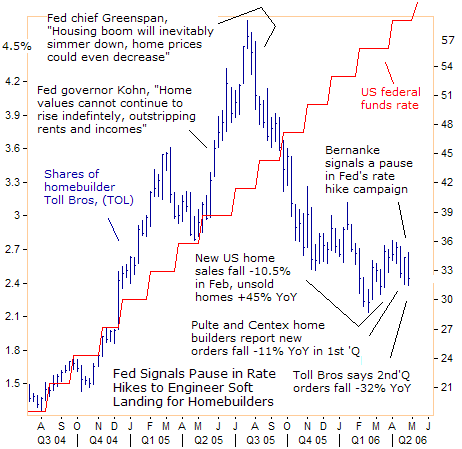
der housing-index
www.stockcharts.com --- Kuerzel: $HGX oder TOL
http://www.321gold.com/editorials/sirchartsalot/dorsch051006…
www.stockcharts.com --- Kuerzel: $HGX oder TOL
http://www.321gold.com/editorials/sirchartsalot/dorsch051006…
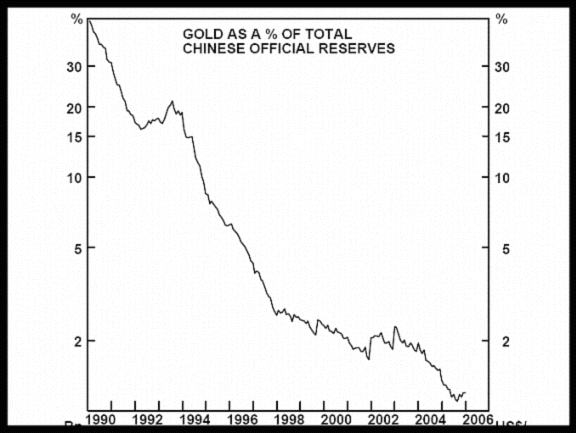
Antwort auf Beitrag Nr.: 21.593.008 von keepitshort am 15.05.06 19:12:20die Goldreserven von China
als Graphik
http://www.goldseiten.de/content/firmen/artikel.php?storyid=…[/url]
als Graphik
http://www.goldseiten.de/content/firmen/artikel.php?storyid=…[/url]
Trading Spotlight
der semiconductor-index sieht nicht gut aus
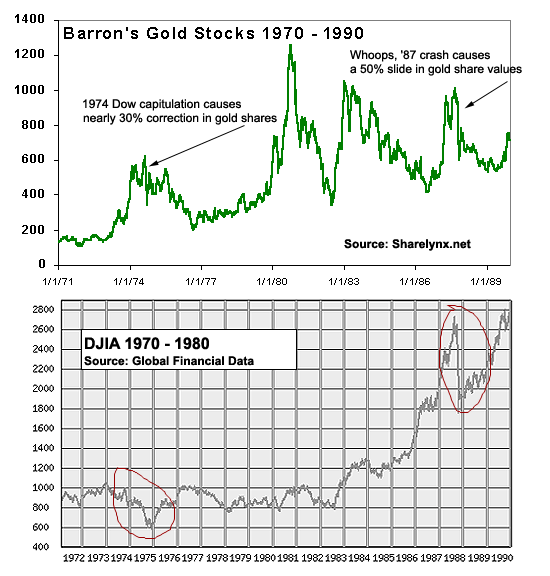
allerdings werden viele das Argument bringen
als 1987 der Aktienindex weltweit stärker korregierte
kamen die Goldminenaktien auch unter Verkaufsdruck
da müsste ich aber jetzt ca. 30 min auf meiner Festplatte
suchen und dann könnte ich diese Argument entkräften.
http://www.financialsense.com/Market/goldberg/2006/0511.html

auch lesenswert
ist leider alles schon bekannt
repetition-drill
http://www.gold-eagle.com/editorials_05/lofberg050506.html
ist leider alles schon bekannt
repetition-drill
http://www.gold-eagle.com/editorials_05/lofberg050506.html
China und die USA
und die USA importiert nicht nur aus China
die USA kaufen und kaufen und kaufen
mit selbstgedruckten Dollars
http://www.gold-eagle.com/editorials_05/dorsch042606.html

und die USA importiert nicht nur aus China
die USA kaufen und kaufen und kaufen
mit selbstgedruckten Dollars
http://www.gold-eagle.com/editorials_05/dorsch042606.html
www.silverseek.com
und
Clive Maund
sind wirklich lesenswert
http://news.silverseek.com/CliveMaund/1145234883.php

und
Clive Maund
sind wirklich lesenswert
http://news.silverseek.com/CliveMaund/1145234883.php
Drehen wir morgen gen Norden ???
jedenfall ne gute Nacht
jedenfall ne gute Nacht
Crash 1987
und nun kommt der Crash2006
Housingindex2006, Semiconductor-Index-2006, US-Dollar-Index
und die US-Bonds
das sieht gar nicht gut aus für den Aktienmarkt
und wie sieht es mit Goldminen aus ???
http://www.gold-eagle.com/gold_digest_03/bugos121003.html
und nun kommt der Crash2006
Housingindex2006, Semiconductor-Index-2006, US-Dollar-Index
und die US-Bonds
das sieht gar nicht gut aus für den Aktienmarkt
und wie sieht es mit Goldminen aus ???
http://www.gold-eagle.com/gold_digest_03/bugos121003.html
sorry
jeder von euch hat bestimmt schon diese Daten im Internet
gesehen, und ich wiederhole mich auch of
aber als repetition-drill ist es doch vielleicht ein kleiner
"incentive"
jeder von euch hat bestimmt schon diese Daten im Internet
gesehen, und ich wiederhole mich auch of
aber als repetition-drill ist es doch vielleicht ein kleiner
"incentive"
bei
www.stockcharts.com --- Kuerzel: $HGX
die housing-bubble und die 200-Tagelinie
If housing prices collapse, what will happen to the demand for copper and zinc? The
demand for both will go down considerably, especially copper, since almost half of its use
is dependent upon construction. Since primary copper mining alone accounts for 26% of
all silver mined every year, there will be much less silver available for the market.
http://www.silverinscripture.com/HousingBubble.html
gefunden bei: http://www.silver-investor.com/ --> featured links
Text u. Graphik bitte nachfolgende URL anklicken
http://www.gold-eagle.com/editorials_05/faber051206.html
Text u. Graphik bitte nachfolgende URL anklicken
http://www.gold-eagle.com/editorials_05/faber051206.html
habe heute mein Konto überprüft
mein Depot hat in den letzten 4 Wochen
ca. 30% an Wert verloren.
Da mein Depot zu 100% aus Silberminen besteht
lohnt sich schon ein finetunig für den Verkauf zu suchen.
Dollar overbought wäre ein Indikator gewesen
10year-T-Bonds overbought wäre der zweite Indikator gewesen
goldpreis war extrem overbought
silberpreis war extrem overbought
die Markttechnik funkioniert also
haber zu sehr
den sinkenden housing-index
den sinkenden semicondutor-index
gewertet
Text u. Graphik:
bitte nachfolgende URL-Adresse anklicken !!!
http://www.gold-eagle.com/editorials_04/dinero091104.html

bitte nachfolgende URL-Adresse anklicken !!!
http://www.gold-eagle.com/editorials_04/dinero091104.html
gefunden bei
www.stockcharts.com
public-charts
Mathew Frailey

www.stockcharts.com
public-charts
Mathew Frailey
www.stockcharts.com
public charts
Mathew Frailey

public charts
Mathew Frailey
www.stockcharts.com
public-charts
Mathew Frailey
public-charts
Mathew Frailey
Definition
http://www.gold-eagle.com/editorials_05/milhouse101705.html
ich ersetze VIPSX durch TIP
hiermit hätte ich
für meine Silberminen
im Mai einen Verkaufspunkt erkennen können
TIP equals infaltionsecured bonds
USB equals 30year-Treasury-Bonds

http://www.gold-eagle.com/editorials_05/milhouse101705.html
ich ersetze VIPSX durch TIP
hiermit hätte ich
für meine Silberminen
im Mai einen Verkaufspunkt erkennen können
TIP equals infaltionsecured bonds
USB equals 30year-Treasury-Bonds
communication
and
information
share

and
information
share
Antwort auf Beitrag Nr.: 23.062.825 von keepitshort am 26.07.06 13:28:50www.stockcharts.com
public-charts
Mathew Frailey

public-charts
Mathew Frailey
Site temporarily unavailable. Data transfer limit exeeded
Hourly limit 4.2 MB
Used 122% allowed 100%
Times exceeded today: 2
Times exceeded this month: 2
Also bitte nur einmal am Tag diese Seite besuchen
Bin bei www.geocities.com
Hourly limit 4.2 MB
Used 122% allowed 100%
Times exceeded today: 2
Times exceeded this month: 2
Also bitte nur einmal am Tag diese Seite besuchen
Bin bei www.geocities.com
mit diesem Chart
will ich den Verkaufszeitpunkt bei Silberminen festlegen
http://www.geocities.com/just_do_it_de_2000/XAU_gold_2years.…
will ich den Verkaufszeitpunkt bei Silberminen festlegen
http://www.geocities.com/just_do_it_de_2000/XAU_gold_2years.…
Definition
http://www.gold-eagle.com/editorials_05/milhouse101705.html
ich ersetze VIPSX durch TIP
hiermit hätte ich
für meine Silberminen
im Mai einen Verkaufspunkt erkennen können
TIP equals infaltionsecured bonds
USB equals 30year-Treasury-Bonds
Ergebnis-URL hier anklicken
http://www.geocities.com/just_do_it_de_2000/TIP_USB_silver.j…
http://www.financialsense.com/Market/goldberg/main.htm
http://www.financialsense.com/Market/goldberg/2006/0803.html
If I had to make an intermediate term call on the direction of the US stock market and could have only 2 charts in which to do it, the following would be the two charts I would use.
ab hier beginnt die Darstellung von member-keepitshort
UST= 10year-US-Treasuries
TLT= 20year-Treasuries als ishares
ARM-definition oder wenn US-Bürger ihre
monatlichen Hausfinanzierungsraten nicht mehr zahlen können
ein schönes Beispiel mit Zahlen
http://www.realestatejournal.com/buysell/mortgages/20060811-…
http://www.europac.net/
economic-market-views --> NewYork-Times
inflation-adjusted to todays Dollars ( year-2006-US-Dollars )

monatlichen Hausfinanzierungsraten nicht mehr zahlen können
ein schönes Beispiel mit Zahlen
http://www.realestatejournal.com/buysell/mortgages/20060811-…
http://www.europac.net/
economic-market-views --> NewYork-Times
inflation-adjusted to todays Dollars ( year-2006-US-Dollars )
die FED ist dein Gegner beim Schachspiel
http://www.financialsense.com/resources/fed/fedwatch.htm
FED-101-Beiträge hier vorher den flashplayer downloaden
dann funktioniet alles
z.B. wie man Zinsen und Geldmenge erklärt
das Barometer Zinsen steigt wenn schnell Geld in die Banken gepumpt wird. Echt super die Darstellung
http://www.federalreserveeducation.org/Fed101/
FED-101-Inflations-Rechner
z.B. 800 Dollar 1979 für Gold hingelegt dann sind dass jetzt ca. 2200.- Dollar
http://www.federalreserveeducation.org/fed101/policy/inflati…
die Analysen von Hartman werde ich irgendwann abonnieren, Hartman ist wirklich sein Geld wert im Gegensatz zu vielen selbsternannten deutschsprachigen Wirtschaftszeitungen.
http://www.financialsense.com/Market/hartman/main.html
http://www.financialsense.com/Market/hartman/2006/1108.html
Today's WrapUp by Mike Hartman 11.08.2006 ( 8th-Nov2006 )
AMERICA VOTES FOR CHANGE – DOLLAR UNDER PRESSURE
The Democratic Party pulled-off some big victories yesterday to gain control of the House of Representatives, and the Senate majority awaits the results from Virginia and Montana. In pre-market trading, stock index futures were under pressure to the downside with the power split in Washington, but overall stock prices stabilized by the second hour of trading. Generally speaking, there is very little volatility in today’s trading across all asset classes including stocks, bonds, currencies, and commodities. As I write, we are now two hours into today’s session, and the Dow Industrials are lower by 0.1%, Ten-year Treasuries are higher by 0.01%, the U.S. Dollar Index is higher by 0.14%, and commodities are mixed with energy prices moving higher. The big focus for investors is to figure out which sectors will be most affected by the outcome of yesterday’s vote.
So far the biggest gainers this morning are the oil and oil services companies with the oil index higher by 1.0% and oil services higher by 1.6%. Energy companies got a boost today with the release of the weekly inventory data showing a smaller than expected build in crude inventories (expected +750,000 barrels, actual +400,000 barrels) and a bigger than expected drawdown of distillate inventories (expected -800,000 barrels, actual -2.7 million barrels). This is the fifth consecutive week of declining distillate inventories. Crude is higher by nearly a dollar to $59.90, heating oil is 2.2% higher at $1.717/gal. and unleaded gasoline is 2.4% higher at $1.56 a gallon. The only other sector flashing noticeable green at the moment is the Utility Sector with a gain of 0.5%. (Watch out for Halliburton in the energy sector as commentators expect the new Congress to subpoena Halliburton to question their no-bid contracts in Iraq.)
By far the biggest sectors getting hit lower today are drugs and healthcare, both down by 1.7%. It is widely assumed the changing of the guard will bring changes to Medicare coverage making future profits more difficult for big-pharma and healthcare companies. The airline sector is also moving lower by 2.4%, in part due to the rising fuel costs, but I’m not sure how much of the decline could be due to less government support expected to bail-out the struggling airlines.The Semiconductor and Computer Indexes are fractionally lower, but fighting to get into positive territory. In terms of volatility, I expect very little change through the balance of today’s trading as the U.S. Treasury is scheduled to auction $19 billion in three-year notes at 1:00pm today. Tomorrow they will borrow another $13 billion with the sale of ten-year notes.
I’m quite sure I sound like a broken record repeating the same things over and over again, but I must say it. On the days surrounding Treasury auctions, don’t expect any great gains in the broad stock market or in commodity prices, especially gold and silver. The main focus for the markets has to be a desire to purchase debt paper. There is no excitement in the gold market today as it was “handled” in the London market with a quick $7 sell-off, and again “handled” $4 lower in New York shortly after the close in London. I have repeatedly stated that the precious metals would remain contained through the elections and the Treasury’s quarterly re-funding. In the last couple weeks, gold has moved from $576 to $631, so some consolidation is in order as we move through the political developments.
Some breaking news just came across the wires with Democrat, John Testor winning in Montana. This gives the Democrats 50 seats in the Senate with the vote from Virginia still pending. It appears we will end-up getting a re-count in Virginia, but it won’t happen until sometime in December based on the state’s voting procedures. Whatever the outcome in Virginia, it is obvious President Bush will have greater obstacles to achieve his objectives. The Bush Administration will now be challenged with greater scrutiny. I consider Jim Kramer one of the greatest all-time salesmen for the Wall Street community. In Kramer’s own words, he considers the new Congress as a “RISK FACTOR” to the markets. (In context, he was referring specifically to the stock markets.) He believes the influence from the Democratic victories will be good for biotech and domestic security companies, but bad for oil, defense and pharmaceutical companies.
Contrast: U.S. Government, California and China
Today ( 8th-Nov-2006) and tomorrow ( 9th-Nov-2006) the U.S. Treasury will borrow $32 billion to pay back old debt and enough additional to continue the government’s deficit spending.
Yesterday California voters approved $43 billion of new debt to “Rebuild California” transportation systems, water infrastructure and schools.
Today we learned China’s October trade surplus soared to yet another all-time high of $23.8 billion…just for the month of October! China’s trade surplus is running about 30% higher than last year and has already reached $133.6 billion year-to-date. China’s exports jumped 29.6% higher, while their imports only rose by 14.7%. China is set to eclipse the one-trillion dollar mark in holdings of U.S. debt paper. It seems to me most folks think of a trillion dollars and say, “Oh well, it is what it is…” In my lifetime, we have transitioned from being the biggest creditor nation in the world to the biggest debtor nation in all of mankind’s history.
Can you get a trillion dollars (that we owe to China) in your mind’s-eye? For a quick visual I will convert dollars to seconds: There are 86,400 seconds in a day.
One million seconds = 11.6 days.
One billion seconds = 31.8 years.
One trillion seconds = 31,800 years!
We glibly throw these numbers around, but what does it mean for our children’s futures? We are permanently in debt!! Looks like we will have to devalue the dollar with continuing monetary inflation to service our debt.
More Breaking News:
Donald Rumsfeld steps down as Defense Secretary. HOORAY!!! Stocks rallied on the news.
On to Housing and the Dollar
The Mortgage Bankers Association said its applications index rose 8.3% with the purchase index higher by 7.1% and the re-fi index higher by 11.0%. Thirty-year fixed rates are unchanged from the prior week at 6.24% and the average one-year ARM fell four basis points to 5.96%. Re-financing is up by 5.5% from a year ago with 30-year fixed rates down from the peak in June at 6.75%. There is still a great deal of debate on the soft-landing scenario for real estate. Some analysts believe the worst is behind us and many believe it will get much worse with increased foreclosures. The way I see it, the Fed will have to choose between supporting the housing market with lower rates versus supporting the dollar with higher interest rates. Based on the enormous debts we owe as a nation, I believe the Fed must err in the favor of inflation and allow the dollar to decline….but what will China do???
A year and a half ago Congress was ready to impose a 28% import tariff on all goods from China, because they have refused to allow their currency to appreciate versus the dollar. As the trade imbalances become larger and larger, it will be important to see if the new Congress will actually do something about the growing imbalances, or just continue to talk about doing something.
In other areas around the globe, business is doing quite well. The European Commission expects growth in Europe to average 2.1% in 2007 versus their previous forecast of 1.8%. With the upward revision for growth in 2007, it is widely expected that the ECB will raise rates again early next year. Yesterday, Bank of Japan Governor Fukui warned the BOJ stands ready to raise interest rates to curb inflation, and today the Reserve Bank of Australia raised their overnight bank lending rate 25 basis points to 6.25%. If the Federal Reserve does nothing to raise interest rates, the dollar will suffer; if they raise rates to support the dollar, housing could get really ugly next year.
In my mind, the key to determining where asset prices are headed next year depends greatly on the dollar in foreign exchange markets. I expect the dollar to move lower, U.S. stocks to move lower, and commodity prices to move higher based on global demand. Commodity prices will move higher due to supply coming up short versus demand, but they will also move higher based on dollar weakness due to monetary inflation. The Fed must inflate or die! There are mounting pressures on the dollar as we turn the corner into 2007.
Rather than go into great detail in this writing, please take the time to read a most excellent article posted yesterday by Jim Willie titled, “Spent Dollar Momentum.” Mr. Willie goes into detail on the inverse correlation of the dollar to energy prices, the U.S. current account deficit, central banker’s revolt from acquiring more dollars, the bear market in home prices, bond yield differentials, and much more. I especially enjoyed the insights he provided from “foreigner’s perspectives” as he spoke with other analysts at the Munich Gold Show last week. Iran has a dotted-line to Russia, and global tensions will continue to increase. Jim expects a very desperate Fed to cut interest rates next year because of a continuing deterioration in the real estate markets. Jim and I are very much in agreement, except for the timing of the rate cut….I’ve been predicting a cut, but I think they will hold out as long as they can until late second quarter or early in the third quarter. A third-quarter re-fi boom will re-liquefy the consumer for back-to-school and holiday shopping in the fourth quarter next year. My main point here is to have you check Jim’s article to see the enormous pressures on the dollar moving forward. It is for these reasons I believe investors should be focused on precious metals, base metals and energy producing companies.
A month ago I commented on zinc inventories going to zero and within a week I was buying shares in zinc mining companies. Today Bloomberg posted the article, “Zinc May Rise Above $5,000 on China, Macquarie Says.” Over the last month inventories continue to decline and the price hits a new record almost daily. In the article a London-based metals analyst, Adam Rowley says, “Zinc looks as though it’s running out.” Another quote from a Swedish copper and zinc producer says, “Consumption still exceeds production.” Some readers have requested specific stock recommendations via email, but please note that I reserve that information for my clients. Others have requested some placed to begin researching the base metal companies. The Bloomberg article linked above has a few names; for a bigger list of prospective targets follow this link to Kitco’s base metals page.
Tomorrow we will get more data on trade balances, the consumer sentiment index, initial jobless claims, import prices and another Treasury auction. It will be fascinating to see how the markets unwind from the lead up to the mid-term elections. The Dow closed at another record high today in spite of a slowing economy and trouble in the real estate markets. Wonders never cease for the Dow!
Have a Great Evening!
Mike Hartman
bei
www.stockcharts.com
Kuerzel-ratio
TIP:TLT
und indicator RSI-14 und PPO 12,26,9
und für oil
USO
$USD
Kuerzel-ratio
$TNX:$IRX
und bei www.stockcharts.com
unter public-charts
Fraily
Winfree
Jack-Chan
www.stockcharts.com
Kuerzel-ratio
TIP:TLT
und indicator RSI-14 und PPO 12,26,9
und für oil
USO
$USD
Kuerzel-ratio
$TNX:$IRX
und bei www.stockcharts.com
unter public-charts
Fraily
Winfree
Jack-Chan
Beitrag zu dieser Diskussion schreiben
Zu dieser Diskussion können keine Beiträge mehr verfasst werden, da der letzte Beitrag vor mehr als zwei Jahren verfasst wurde und die Diskussion daraufhin archiviert wurde.
Bitte wenden Sie sich an feedback@wallstreet-online.de und erfragen Sie die Reaktivierung der Diskussion oder starten Sie eine neue Diskussion.
Meistdiskutiert
| Wertpapier | Beiträge | |
|---|---|---|
| 135 | ||
| 82 | ||
| 71 | ||
| 58 | ||
| 56 | ||
| 38 | ||
| 36 | ||
| 33 | ||
| 30 | ||
| 26 |
| Wertpapier | Beiträge | |
|---|---|---|
| 25 | ||
| 25 | ||
| 24 | ||
| 22 | ||
| 19 | ||
| 17 | ||
| 16 | ||
| 15 | ||
| 15 | ||
| 14 |


