


Globale Erwärmung durch Treibhauseffekt - nur ein Mythos der Linken? (Seite 3773)
eröffnet am 15.06.06 17:59:51 von
neuester Beitrag 24.05.24 20:44:14 von
neuester Beitrag 24.05.24 20:44:14 von
Beiträge: 58.018
ID: 1.066.312
ID: 1.066.312
Aufrufe heute: 16
Gesamt: 1.508.026
Gesamt: 1.508.026
Aktive User: 0
Top-Diskussionen
| Titel | letzter Beitrag | Aufrufe |
|---|---|---|
| vor 55 Minuten | 5243 | |
| vor 25 Minuten | 3252 | |
| vor 25 Minuten | 3162 | |
| vor 50 Minuten | 2930 | |
| vor 53 Minuten | 1736 | |
| vor 25 Minuten | 1551 | |
| vor 52 Minuten | 1504 | |
| heute 15:00 | 1354 |
Meistdiskutierte Wertpapiere
| Platz | vorher | Wertpapier | Kurs | Perf. % | Anzahl | ||
|---|---|---|---|---|---|---|---|
| 1. | 5. | 18.756,93 | +0,31 | 147 | |||
| 2. | Neu! | 24,055 | +37,32 | 53 | |||
| 3. | 1. | 9,7400 | +4,17 | 50 | |||
| 4. | 3. | 54,00 | +13,92 | 44 | |||
| 5. | 20. | 0,1985 | -5,48 | 37 | |||
| 6. | 2. | 162,86 | -1,44 | 36 | |||
| 7. | 8. | 0,3340 | +10,96 | 31 | |||
| 8. | 22. | 5,7460 | -1,68 | 30 |
Beitrag zu dieser Diskussion schreiben
Antwort auf Beitrag Nr.: 40.208.329 von depodoc am 24.09.10 20:41:51Kannst du bitte mal erklären, wo das IPCC diesen "Hot Spot" als Fingerprint des CO2 ausgegeben haben soll?
#20170 von mouse_potato
Wer wäre nicht überrascht?
Mich hats auch überrascht und hab deshalb McKay quergelesen.
Interessant, dass die Arktis keine gleichmässigen Klimaverhältnisse ausweist, sondern sich regional unterschiedlich entwickeln kann.
Die Messtelle, core HLY0501-05, zeigt auf alle Fälle, dass es auch ohne "unser" CO2 dort schon mal wärmer war.
Antwort auf Beitrag Nr.: 40.206.453 von rv_2011 am 24.09.10 16:20:57Klar rv, Watts hat mal wieder verfälscht 
Nach 20 tsd Postings in denen du jetzt schon danebenliegst solltest du langsam mal die Möglichkeit in Betracht ziehen dass du falsch liegst.

Nach 20 tsd Postings in denen du jetzt schon danebenliegst solltest du langsam mal die Möglichkeit in Betracht ziehen dass du falsch liegst.
Nachtrag:
Hier fehlt ein "nicht" : "Mit "Fingerprint" meine ich den von Schelli.."
"Widerlegt" ist der "Fingerprint", da die Erwärmung bei korrekter Berechnung nach Christy et.al. statistisch nicht signifikant ist und im "Rauschen der Nachkommastellen" untergeht.
Hier fehlt ein "nicht" : "Mit "Fingerprint" meine ich den von Schelli.."
"Widerlegt" ist der "Fingerprint", da die Erwärmung bei korrekter Berechnung nach Christy et.al. statistisch nicht signifikant ist und im "Rauschen der Nachkommastellen" untergeht.
#20164 von rv
Ich bin nur etwas überrascht von dir zu hören, "... da der "Fingerprint" widerlegt ist".
Mit "Fingerprint" meine ich den von Schelli, sondern hier ist selbstverständlich der zusätzliche Erwärmungseffekt durch "unser" CO2 gemeint, der sich im Tropengürtel im 200 hPa Bereich unter der Tropospause abspielen soll. Dort soll sich nach euren Modellen die Erwärmung besonders leicht nachweisen lassen.
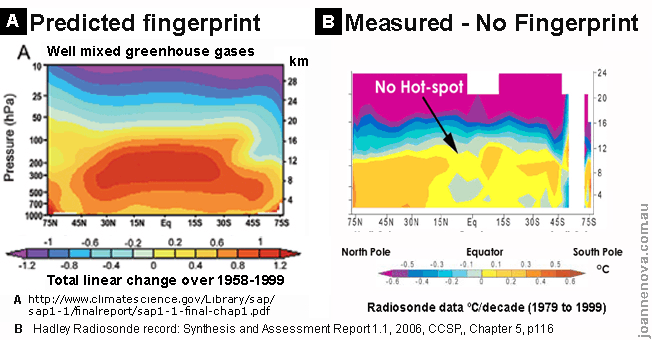
Kritik daran gab es u.a. von Douglass et.al, der mit Radiosonden-Messungen nachwies, dass es diese Erwärmung in dieser Höhe so nicht gibt.
Daraufhin habt ihr dann entdeckt, dass in euren Modellen der Wind mit seiner abkühlende Wirkung fehlt und habt dann u.a. ( Allen and Sherwwood ) mit dem Wind als Kühlfaktor trotzdem noch die Erwärmung durch "unser" CO2 behauptet.
Dass dieser Wind im Tropengürtel nur "Heisse Luft" ist, geht aus Pielke sen. hervor, wobei ich dazu ja schon verlinkt habe.
September 17, 2010...7:00 am
Conclusions From Allen and Sherwood (2008) and Thorne (2008) Are Refuted
Christy, J.R., Herman, B., Pielke, R., Sr., Klotzbach, P., McNider, R.T., Hnilo, J.J., Spencer, R.W., Chase, T., and Douglass, D. What Do Observational Datasets Say about Modeled Tropospheric Temperature Trends since 1979?. Remote Sens. 2010, 2, 2148-2169
..In other words, The Allen and Sherwood (2008) finding that
“Over the period of observations, we find a maximum warming trend of 0.650.47 K per decade near the 200 hPa pressure level, below the tropical tropopause. Warming patterns are consistent with model predictions except for small discrepancies close to the tropopause……The agreement with models increases confidence in current model-based predictions of future climate change”
has been refuted as reported in the Christy et al 2010 paper.
http://pielkeclimatesci.wordpress.com/2010/09/17/conclusions…
Wenn die Alarmisten bei Null Grad Erwärmung trotdem einen "Hot Spot" finden, ist das kein physikalisches Wunder ( wie beim Regen, der duch Schnee bis zum Boden fällt und am Schnee ändert sich nichts ), sondern das ist ganz einfach "Heisse Luft".
Sherwood 2008: Where you can find a hot spot at zero degrees..
http://joannenova.com.au/2010/07/sherwood-2008-where-you-can…
Ich bin nur etwas überrascht von dir zu hören, "... da der "Fingerprint" widerlegt ist".
Mit "Fingerprint" meine ich den von Schelli, sondern hier ist selbstverständlich der zusätzliche Erwärmungseffekt durch "unser" CO2 gemeint, der sich im Tropengürtel im 200 hPa Bereich unter der Tropospause abspielen soll. Dort soll sich nach euren Modellen die Erwärmung besonders leicht nachweisen lassen.
Kritik daran gab es u.a. von Douglass et.al, der mit Radiosonden-Messungen nachwies, dass es diese Erwärmung in dieser Höhe so nicht gibt.
Daraufhin habt ihr dann entdeckt, dass in euren Modellen der Wind mit seiner abkühlende Wirkung fehlt und habt dann u.a. ( Allen and Sherwwood ) mit dem Wind als Kühlfaktor trotzdem noch die Erwärmung durch "unser" CO2 behauptet.
Dass dieser Wind im Tropengürtel nur "Heisse Luft" ist, geht aus Pielke sen. hervor, wobei ich dazu ja schon verlinkt habe.
September 17, 2010...7:00 am
Conclusions From Allen and Sherwood (2008) and Thorne (2008) Are Refuted
Christy, J.R., Herman, B., Pielke, R., Sr., Klotzbach, P., McNider, R.T., Hnilo, J.J., Spencer, R.W., Chase, T., and Douglass, D. What Do Observational Datasets Say about Modeled Tropospheric Temperature Trends since 1979?. Remote Sens. 2010, 2, 2148-2169
..In other words, The Allen and Sherwood (2008) finding that
“Over the period of observations, we find a maximum warming trend of 0.650.47 K per decade near the 200 hPa pressure level, below the tropical tropopause. Warming patterns are consistent with model predictions except for small discrepancies close to the tropopause……The agreement with models increases confidence in current model-based predictions of future climate change”
has been refuted as reported in the Christy et al 2010 paper.
http://pielkeclimatesci.wordpress.com/2010/09/17/conclusions…
Wenn die Alarmisten bei Null Grad Erwärmung trotdem einen "Hot Spot" finden, ist das kein physikalisches Wunder ( wie beim Regen, der duch Schnee bis zum Boden fällt und am Schnee ändert sich nichts ), sondern das ist ganz einfach "Heisse Luft".
Sherwood 2008: Where you can find a hot spot at zero degrees..
http://joannenova.com.au/2010/07/sherwood-2008-where-you-can…
Trading Spotlight
Antwort auf Beitrag Nr.: 40.206.410 von rv_2011 am 24.09.10 16:15:23Jetzt richtig verlinkt:
Watts verfälscht nicht nur die Aussage des Papers von McKay et al. - sein "surprise" ist zudem ein alter Hut:
[urlSurprise: Peer reviewed study says current Arctic sea ice is more extensive than most of the past 9000 years
Posted on September 23, 2010 by Anthony Watts]http://wattsupwiththat.com/2010/09/23/surprise-peer-reviewed-study-says-current-arctic-sea-ice-is-more-extensive-than-most-of-the-past-9000-years[/url]
Diese inhaltlich falsche Aussage bezieht sich auf ein zwei Jahre altes Paper:
[urlHolocene fluctuations in Arctic sea-ice cover: dinocyst-based reconstructions for the eastern Chukchi Sea
J.L. McKay, A. de Vernal, C. Hillaire-Marcel, C. Not, L. Polyak, and D. Darby
Received 28 April 2008. Accepted 10 September 2008. Published on the NRC Research Press Web site at cjes.nrc.ca on 30 October 2008]http://bprc.osu.edu/geo/publications/mckay_etal_CJES_08.pdf[/url]
Antwort auf Beitrag Nr.: 40.205.390 von rv_2011 am 24.09.10 14:31:04Ich sehe gerade, dass Watts nicht nur die Aussage des Papers von McKay et al. völlig verfälscht - sein "surprise" ist zudem ein schon zwei Jahre angegammelter Hut:
[urlSurprise: Peer reviewed study says current Arctic sea ice is more extensive than most of the past 9000 years
Posted on September 23, 2010 by Anthony Watts
]http://wattsupwiththat.com/2010/09/23/surprise-peer-reviewed-study-says-current-arctic-sea-ice-is-more-extensive-than-most-of-the-past-9000-years[/url]
bezieht sich auf
[urlHolocene fluctuations in Arctic sea-ice cover: dinocyst-based reconstructions for the eastern Chukchi Sea
J.L. McKay, A. de Vernal, C. Hillaire-Marcel, C. Not, L. Polyak, and D. Darby
Received 28 April 2008. Accepted 10 September 2008. Published on the NRC Research Press Web site at cjes.nrc.ca on 30 October 2008][/url]
Mit solch trüben Quellen wie Watts wird das nie was ...
Antwort auf Beitrag Nr.: 40.203.047 von mouse_potato am 24.09.10 09:11:30Current Arctic Sea Ice is More Extensive than Most of the past 9000 Years
Da hat dir mal wieder Watts einen Bären aufgebunden: Eine solche Aussage findet sich weder explizit noch implizit in dem zitierten Paper.
...More importantly, there have been times when sea-ice cover was less extensive than at the end of the 20th century....
Das Paper untersucht nur Teile des west-arktischen Ozeans; es wird explizit gesagt, dass die Ostarktis sich teils entgegengesetzt entwickelt hat. Der dramatische Rückgang des Arktiseises fand zudem nicht am Ende des 20., sondern zu Beginn des 21. Jahrhunderts statt.
Da hat dir mal wieder
 Watts einen Bären aufgebunden: Eine solche Aussage findet sich weder explizit noch implizit in dem zitierten Paper.
 ...More importantly, there have been times when sea-ice cover was less extensive than at the end of the 20th century....
Das Paper untersucht nur Teile des west-arktischen Ozeans; es wird explizit gesagt, dass die Ostarktis sich teils entgegengesetzt entwickelt hat. Der dramatische Rückgang des Arktiseises fand zudem nicht am Ende des 20., sondern zu Beginn des 21. Jahrhunderts statt.
Antwort auf Beitrag Nr.: 40.202.119 von depodoc am 23.09.10 22:56:26Was das IPCC unter "Fingerprint" versteht, weiß ich. Das ist im IPCC-WG1-Bericht z.B. in Kapitel 1.3.1 definiert (http://www.ipcc.ch/publications_and_data/ar4/wg1/en/ch1s1-3.…).
Ich bin nur etwas überrascht von dir zu hören, "... da der "Fingerprint" widerlegt ist".
Kannst du mir vielleicht sagen, welche der Aussagen in Abschnitt 1.3.1 widerlegt ist/sind:
1.3.1 The Human Fingerprint on Greenhouse Gases
The high-accuracy measurements of atmospheric CO2 concentration, initiated by Charles David Keeling in 1958, constitute the master time series documenting the changing composition of the atmosphere (Keeling, 1961, 1998). These data have iconic status in climate change science as evidence of the effect of human activities on the chemical composition of the global atmosphere (see FAQ 7.1). Keeling’s measurements on Mauna Loa in Hawaii provide a true measure of the global carbon cycle, an effectively continuous record of the burning of fossil fuel. They also maintain an accuracy and precision that allow scientists to separate fossil fuel emissions from those due to the natural annual cycle of the biosphere, demonstrating a long-term change in the seasonal exchange of CO2 between the atmosphere, biosphere and ocean. Later observations of parallel trends in the atmospheric abundances of the 13CO2 isotope (Francey and Farquhar, 1982) and molecular oxygen (O2) (Keeling and Shertz, 1992; Bender et al., 1996) uniquely identified this rise in CO2 with fossil fuel burning (Sections 2.3, 7.1 and 7.3).
To place the increase in CO2 abundance since the late 1950s in perspective, and to compare the magnitude of the anthropogenic increase with natural cycles in the past, a longer-term record of CO2 and other natural greenhouse gases is needed. These data came from analysis of the composition of air enclosed in bubbles in ice cores from Greenland and Antarctica. The initial measurements demonstrated that CO2 abundances were significantly lower during the last ice age than over the last 10 kyr of the Holocene (Delmas et al., 1980; Berner et al., 1980; Neftel et al., 1982). From 10 kyr before present up to the year 1750, CO2 abundances stayed within the range 280 ± 20 ppm (Indermühle et al., 1999). During the industrial era, CO2 abundance rose roughly exponentially to 367 ppm in 1999 (Neftel et al., 1985; Etheridge et al., 1996; IPCC, 2001a) and to 379 ppm in 2005 (Section 2.3.1; see also Section 6.4).
Direct atmospheric measurements since 1970 (Steele et al., 1996) have also detected the increasing atmospheric abundances of two other major greenhouse gases, methane (CH4) and nitrous oxide (N2O). Methane abundances were initially increasing at a rate of about 1% yr–1 (Graedel and McRae, 1980; Fraser et al., 1981; Blake et al., 1982) but then slowed to an average increase of 0.4% yr–1 over the 1990s (Dlugokencky et al., 1998) with the possible stabilisation of CH4 abundance (Section 2.3.2). The increase in N2O abundance is smaller, about 0.25% yr–1, and more difficult to detect (Weiss, 1981; Khalil and Rasmussen, 1988). To go back in time, measurements were made from firn air trapped in snowpack dating back over 200 years, and these data show an accelerating rise in both CH4 and N2O into the 20th century (Machida et al., 1995; Battle et al., 1996). When ice core measurements extended the CH4 abundance back 1 kyr, they showed a stable, relatively constant abundance of 700 ppb until the 19th century when a steady increase brought CH4 abundances to 1,745 ppb in 1998 (IPCC, 2001a) and 1,774 ppb in 2005 (Section 2.3.2). This peak abundance is much higher than the range of 400 to 700 ppb seen over the last half-million years of glacial-interglacial cycles, and the increase can be readily explained by anthropogenic emissions. For N2O the results are similar: the relative increase over the industrial era is smaller (15%), yet the 1998 abundance of 314 ppb (IPCC, 2001a), rising to 319 ppb in 2005 (Section 2.3.3), is also well above the 180-to-260 ppb range of glacial-interglacial cycles (Flückiger et al., 1999; see Sections 2.3, 6.2, 6.3, 6.4, 7.1 and 7.4)
Several synthetic halocarbons (chlorofluorocarbons (CFCs), hydrofluorocarbons, perfluorocarbons, halons and sulphur hexafluoride) are greenhouse gases with large global warming potentials (GWPs; Section 2.10). The chemical industry has been producing these gases and they have been leaking into the atmosphere since about 1930. Lovelock (1971) first measured CFC-11 (CFCl3) in the atmosphere, noting that it could serve as an artificial tracer, with its north-south gradient reflecting the latitudinal distribution of anthropogenic emissions. Atmospheric abundances of all the synthetic halocarbons were increasing until the 1990s, when the abundance of halocarbons phased out under the Montreal Protocol began to fall (Montzka et al., 1999; Prinn et al., 2000). In the case of synthetic halocarbons (except perfluoromethane), ice core research has shown that these compounds did not exist in ancient air (Langenfelds et al., 1996) and thus confirms their industrial human origin (see Sections 2.3 and 7.1).
At the time of the TAR scientists could say that the abundances of all the well-mixed greenhouse gases during the 1990s were greater than at any time during the last half-million years (Petit et al, 1999), and this record now extends back nearly one million years (Section 6.3). Given this daunting picture of increasing greenhouse gas abundances in the atmosphere, it is noteworthy that, for simpler challenges but still on a hemispheric or even global scale, humans have shown the ability to undo what they have done. Sulphate pollution in Greenland was reversed in the 1980s with the control of acid rain in North America and Europe (IPCC, 2001b), and CFC abundances are declining globally because of their phase-out undertaken to protect the ozone layer.
Surprise: Peer reviewed study says current Arctic sea ice is more extensive than most of the past 9000 years
...Arctic sea ice extent at the end of the 20th century was more extensive than most of the past 9000 years...
...The paper also finds that Arctic sea ice extent was on a declining trend over the past 9000 years, but recovered beginning sometime over the past 1000 years and has been relatively stable and extensive since....
...More importantly, there have been times when sea-ice cover was less extensive than at the end of the 20th century....
http://wattsupwiththat.com/2010/09/23/surprise-peer-reviewed…" target="_blank" rel="nofollow ugc noopener">http://wattsupwiththat.com/2010/09/23/surprise-peer-reviewed…
Zur Studie:
http://bprc.osu.edu/geo/publications/mckay_etal_CJES_08.pdf
Peer-reviewed.


